
Page 328 - Marks Calculation for Machine Design
P. 328
P1: Shashi
January 4, 2005
Brown˙C07
Brown.cls
310
Step 13. Calculate the factor-of-safety (n) using Eq. (7.34), which represents the distance
(d) in Fig. 7.24, as 15:4 STRENGTH OF MACHINES
1 τ a τ m 27.8MPa 278.0MPa
= + = + = (0.644) + (0.659) = 1.303
n S e S us 43.2MPa 422.1MPa
1
n = = 0.77 (unsafe!)
1.303
which means the design is unsafe, because the factor-of-safety n is less than 1.
The main reason the design is unsafe is the fact that in step 8 the test specimen en-
durance limit (S ) was reduced by over 85 percent, primarily due to the surface finish
e
factor (k a ) that was calculated in step 1 to be 0.45, which is a 55 percent reduction by
itself.
Just for curiosity, what if the endurance limit were doubled, from 43.2 MPa to 86.4 MPa,
howwouldthischangethefactor-of-safety(n)?Substitutingthisnewvaluefortheendurance
limit (S e ) into the Goodman theory, previously calculated in step 13 above, gives a safe
value.
1 τ a τ m 27.8MPa 278.0MPa
= + = + = (0.322) + (0.659) = 0.981
n S e S us 86.4MPa 422.1MPa
1
n = = 1.02 (not by much, but safe!)
0.981
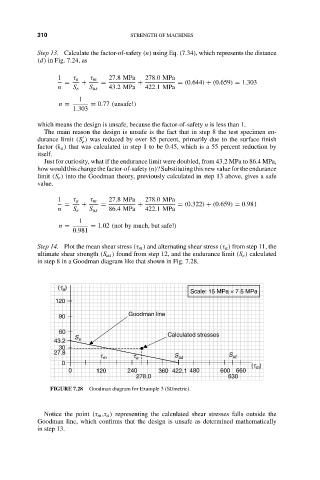
Step 14. Plot the mean shear stress (τ m ) and alternating shear stress (τ a ) from step 11, the
ultimate shear strength (S us ) found from step 12, and the endurance limit (S e ) calculated
in step 8 in a Goodman diagram like that shown in Fig. 7.28.
(t )
a
Scale: 15 MPa × 7.5 MPa
120
90 Goodman line
60
S Calculated stresses
43.2 e
30
27.8
t m t a S us S ut
0
(t )
m
0 120 240 360 422.1 480 600 660
278.0 630
FIGURE 7.28 Goodman diagram for Example 3 (SI/metric).
Notice the point (τ m ,τ a ) representing the calculated shear stresses falls outside the
Goodman line, which confirms that the design is unsafe as determined mathematically
in step 13.