Page 87 - Marks Calculation for Machine Design
P. 87

P1: Sanjay
                          January 4, 2005
                 Brown˙C02
        Brown.cls
                          V
                              F       16:18      BEAMS                             69
                                    +
                                                                   a
                              0                                               x
                                    a                                    L
                                                                   –
                             –F
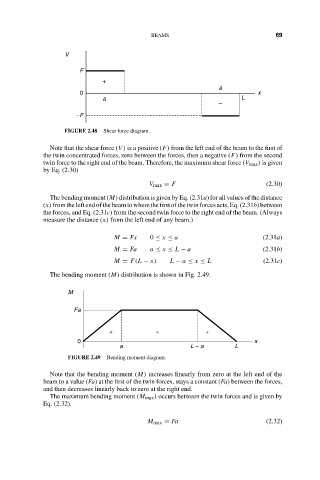
                          FIGURE 2.48  Shear force diagram.
                      Note that the shear force (V ) is a positive (F) from the left end of the beam to the first of
                    the twin concentrated forces, zero between the forces, then a negative (F) from the second
                    twin force to the right end of the beam. Therefore, the maximum shear force (V max ) is given
                    by Eq. (2.30)
                                                 V max = F                      (2.30)

                      The bending moment (M) distribution is given by Eq. (2.31a) for all values of the distance
                    (x) from the left end of the beam to where thefirst of the twin forces acts, Eq. (2.31b) between
                    the forces, and Eq. (2.31c) from the second twin force to the right end of the beam. (Always
                    measure the distance (x) from the left end of any beam.)

                                       M = Fx    0 ≤ x ≤ a                     (2.31a)
                                       M = Fa    a ≤ x ≤ L − a                 (2.31b)
                                       M = F(L − x)   L − a ≤ x ≤ L            (2.31c)
                      The bending moment (M) distribution is shown in Fig. 2.49.


                           M
                            Fa


                                      +           +             +
                             0                                               x
                                         a                  L – a       L
                           FIGURE 2.49  Bending moment diagram.

                      Note that the bending moment (M) increases linearly from zero at the left end of the
                    beam to a value (Fa) at the first of the twin forces, stays a constant (Fa) between the forces,
                    and then decreases linearly back to zero at the right end.
                      The maximum bending moment (M max ) occurs between the twin forces and is given by
                    Eq. (2.32).

                                                M max = Fa                      (2.32)
   82   83   84   85   86   87   88   89   90   91   92