
Page 296 - Materials Science and Engineering An Introduction
P. 296
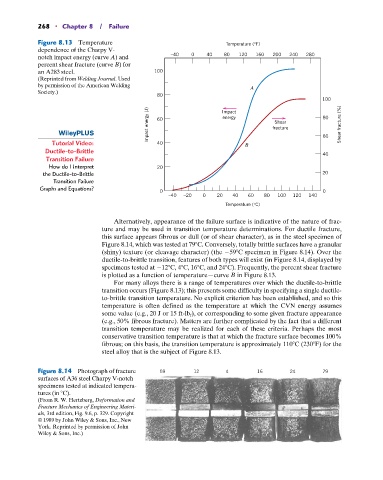
268   •  Chapter 8  /  Failure

            Figure 8.13  Temperature                                 Temperature (°F)
            dependence of the Charpy V-
            notch impact energy (curve A) and       –40   0    40   80   120  160  200  240  280
              percent shear fracture (curve B) for
            an A283 steel.                     100
            (Reprinted from Welding Journal. Used
            by permission of the American Welding                           A
            Society.)
                                                80
                                                                                                  100
                                             Impact energy (J)  60  energy         fracture       80   Shear fracture (%)
                                                                    Impact
                                                                                   Shear


                 Tutorial Video:                40                         B                      60
               Ductile-to-Brittle                                                                 40
               Transition Failure
                How do I Interpret              20
              the Ductile-to-Brittle                                                              20
                 Transition Failure
             Graphs and Equations?
                                                 0                                                0
                                                    –40  –20  0   20   40  60   80  100  120  140
                                                                     Temperature (°C)

                                   Alternatively, appearance of the failure surface is indicative of the nature of frac-
                                ture and may be used in transition temperature determinations. For ductile fracture,
                                this surface appears fibrous or dull (or of shear character), as in the steel specimen of
                                Figure 8.14, which was tested at 79 C. Conversely, totally brittle surfaces have a granular
                                (shiny) texture (or cleavage character) (the 	59 C specimen in Figure 8.14). Over the
                                ductile-to-brittle transition, features of both types will exist (in Figure 8.14, displayed by
                                specimens tested at 	12 C, 4 C, 16 C, and 24 C). Frequently, the percent shear fracture
                                is plotted as a function of temperature—curve B in Figure 8.13.
                                   For many alloys there is a range of temperatures over which the ductile-to-brittle
                                transition occurs (Figure 8.13); this presents some difficulty in specifying a single ductile-
                                to-brittle transition temperature. No explicit criterion has been established, and so this
                                temperature is often defined as the temperature at which the CVN energy assumes
                                some value (e.g., 20 J or 15 ft-lb f ), or corresponding to some given fracture appearance
                                (e.g., 50% fibrous fracture). Matters are further complicated by the fact that a  different
                                transition temperature may be realized for each of these criteria. Perhaps the most
                                conservative transition temperature is that at which the fracture surface becomes 100%
                                fibrous; on this basis, the transition temperature is approximately 110 C (230 F) for the
                                steel alloy that is the subject of Figure 8.13.


            Figure 8.14  Photograph of fracture    59      12        4        16        24        79
            surfaces of A36 steel Charpy V-notch
            specimens tested at indicated tempera-
            tures (in  C).
            (From R. W. Hertzberg, Deformation and
            Fracture Mechanics of Engineering Materi-
            als, 3rd edition, Fig. 9.6, p. 329. Copyright
            © 1989 by John Wiley & Sons, Inc., New
            York. Reprinted by permission of John
            Wiley & Sons, Inc.)