
Page 300 - Materials Science and Engineering An Introduction
P. 300
272 • Chapter 8 / Failure
8.8 THE S–N CURVE
As with other mechanical characteristics, the fatigue properties of materials can be deter-
7
mined from laboratory simulation tests. A test apparatus should be designed to duplicate
as nearly as possible the service stress conditions (stress level, time frequency, stress pattern,
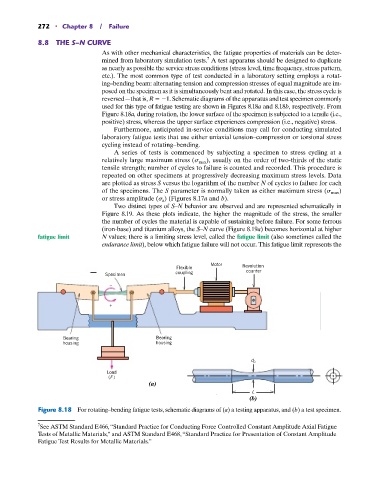
etc.). The most common type of test conducted in a laboratory setting employs a rotat-
ing–bending beam: alternating tension and compression stresses of equal magnitude are im-
posed on the specimen as it is simultaneously bent and rotated. In this case, the stress cycle is
reversed—that is, R 1. Schematic diagrams of the apparatus and test specimen commonly
used for this type of fatigue testing are shown in Figures 8.18a and 8.18b, respectively. From
Figure 8.18a, during rotation, the lower surface of the specimen is subjected to a tensile (i.e.,
positive) stress, whereas the upper surface experiences compression (i.e., negative) stress.
Furthermore, anticipated in-service conditions may call for conducting simulated
laboratory fatigue tests that use either uniaxial tension–compression or torsional stress
cycling instead of rotating–bending.
A series of tests is commenced by subjecting a specimen to stress cycling at a
relatively large maximum stress (s max ), usually on the order of two-thirds of the static
tensile strength; number of cycles to failure is counted and recorded. This procedure is
repeated on other specimens at progressively decreasing maximum stress levels. Data
are plotted as stress S versus the logarithm of the number N of cycles to failure for each
of the specimens. The S parameter is normally taken as either maximum stress (s max )
or stress amplitude (s a ) (Figures 8.17a and b).
Two distinct types of S–N behavior are observed and are represented schematically in
Figure 8.19. As these plots indicate, the higher the magnitude of the stress, the smaller
the number of cycles the material is capable of sustaining before failure. For some ferrous
(iron-base) and titanium alloys, the S–N curve (Figure 8.19a) becomes horizontal at higher
fatigue limit N values; there is a limiting stress level, called the fatigue limit (also sometimes called the
endurance limit), below which fatigue failure will not occur. This fatigue limit represents the
Motor Revolution
Flexible
coupling counter
Specimen
–
+
Bearing Bearing
housing housing
d 0
Load
(F )
(a)
L
(b)
Figure 8.18 For rotating–bending fatigue tests, schematic diagrams of (a) a testing apparatus, and (b) a test specimen.
7 See ASTM Standard E466, “Standard Practice for Conducting Force Controlled Constant Amplitude Axial Fatigue
Tests of Metallic Materials,” and ASTM Standard E468, “Standard Practice for Presentation of Constant Amplitude
Fatigue Test Results for Metallic Materials.”