
Page 301 - Materials Science and Engineering An Introduction
P. 301
8.8 The S–N Curve • 273
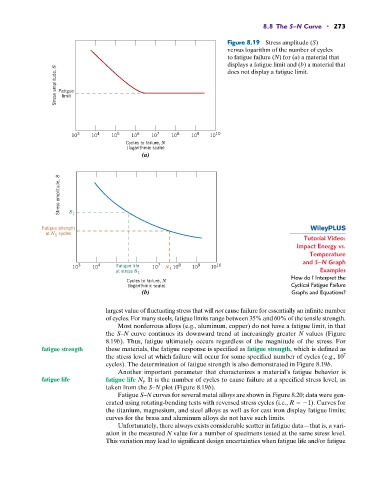
Figure 8.19 Stress amplitude (S)
versus logarithm of the number of cycles
to fatigue failure (N) for (a) a material that
displays a fatigue limit and (b) a material that
Stress amplitude, S Fatigue
does not display a fatigue limit.
limit
10 3 10 4 10 5 10 6 10 7 10 8 10 9 10 10
Cycles to failure, N
(logarithmic scale)
(a)
Stress amplitude, S
S
Fatigue strength 1
cycles
at N 1
Tutorial Video:
Impact Energy vs.
Temperature
and S–N Graph
3 4 Fatigue life 7 8 9 10
10 10 10 N 10 10 10
1
at stress S 1 Examples
How do I Interpret the
Cycles to failure, N
(logarithmic scale) Cyclical Fatigue Failure
(b) Graphs and Equations?
largest value of fluctuating stress that will not cause failure for essentially an infinite number
of cycles. For many steels, fatigue limits range between 35% and 60% of the tensile strength.
Most nonferrous alloys (e.g., aluminum, copper) do not have a fatigue limit, in that
the S–N curve continues its downward trend at increasingly greater N values (Figure
8.19b). Thus, fatigue ultimately occurs regardless of the magnitude of the stress. For
fatigue strength these materials, the fatigue response is specified as fatigue strength, which is defined as
7
the stress level at which failure will occur for some specified number of cycles (e.g., 10
cycles). The determination of fatigue strength is also demonstrated in Figure 8.19b.
Another important parameter that characterizes a material’s fatigue behavior is
fatigue life fatigue life N f . It is the number of cycles to cause failure at a specified stress level, as
taken from the S–N plot (Figure 8.19b).
Fatigue S–N curves for several metal alloys are shown in Figure 8.20; data were gen-
erated using rotating-bending tests with reversed stress cycles (i.e., R 1). Curves for
the titanium, magnesium, and steel alloys as well as for cast iron display fatigue limits;
curves for the brass and aluminum alloys do not have such limits.
Unfortunately, there always exists considerable scatter in fatigue data—that is, a vari-
ation in the measured N value for a number of specimens tested at the same stress level.
This variation may lead to significant design uncertainties when fatigue life and/or fatigue