
Page 297 - Materials Science and Engineering An Introduction
P. 297
8.6 Fracture Toughness Testing • 269
Structures constructed from alloys that exhibit this ductile-to-brittle behavior
should be used only at temperatures above the transition temperature to avoid brittle
and catastrophic failure. Classic examples of this type of failure were discussed in the
case study found in Chapter 1. During World War II, a number of welded transport
ships away from combat suddenly split in half. The vessels were constructed of a steel al-
loy that possessed adequate toughness according to room-temperature tensile tests. The
brittle fractures occurred at relatively low ambient temperatures, at about 4 C (40 F),
in the vicinity of the transition temperature of the alloy. Each fracture crack originated
at some point of stress concentration, probably a sharp corner or fabrication defect, and
then propagated around the entire girth of the ship.
In addition to the ductile-to-brittle transition represented in Figure 8.13, two other
general types of impact energy–versus–temperature behavior have been observed; these
are represented schematically by the upper and lower curves of Figure 8.15. Here it may
be noted that low-strength FCC metals (some aluminum and copper alloys) and most HCP
metals do not experience a ductile-to-brittle transition (corresponding to the upper curve of
Figure 8.15) and retain high impact energies (i.e., remain tough) with decreasing tempera-
ture. For high-strength materials (e.g., high-strength steels and titanium alloys), the impact
energy is also relatively insensitive to temperature (the lower curve of Figure 8.15); however,
these materials are also very brittle, as reflected by their low impact energies. The character-
istic ductile-to-brittle transition is represented by the middle curve of Figure 8.15. As noted,
Tutorial Video: this behavior is typically found in low-strength steels that have the BCC crystal structure.
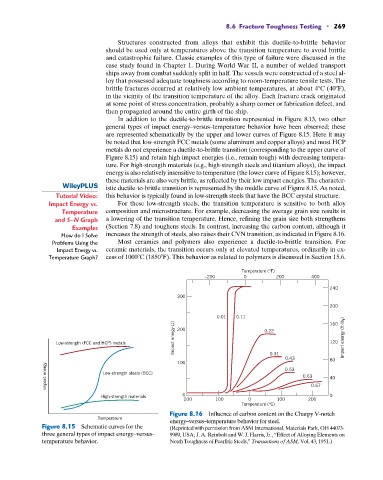
Impact Energy vs. For these low-strength steels, the transition temperature is sensitive to both alloy
Temperature composition and microstructure. For example, decreasing the average grain size results in
and S–N Graph a lowering of the transition temperature. Hence, refining the grain size both strengthens
Examples (Section 7.8) and toughens steels. In contrast, increasing the carbon content, although it
How do I Solve increases the strength of steels, also raises their CVN transition, as indicated in Figure 8.16.
Problems Using the Most ceramics and polymers also experience a ductile-to-brittle transition. For
Impact Energy vs. ceramic materials, the transition occurs only at elevated temperatures, ordinarily in ex-
Temperature Graph? cess of 1000 C (1850 F). This behavior as related to polymers is discussed in Section 15.6.
Temperature (°F)
–200 0 200 400
240
300
200
0.01 0.11 160
Impact energy (J) 200 0.22 Impact energy (ft-lb f )
Low-strength (FCC and HCP) metals 120
0.31
0.43 80
100 0.53
Impact energy Low-strength steels (BCC) 0.63 0.67 40
High-strength materials 0 0
–200 –100 0 100 200
Temperature (°C)
Figure 8.16 Influence of carbon content on the Charpy V-notch
Temperature energy–versus–temperature behavior for steel.
Figure 8.15 Schematic curves for the (Reprinted with permission from ASM International, Materials Park, OH 44073-
three general types of impact energy–versus– 9989, USA; J. A. Reinbolt and W. J. Harris, Jr., “Effect of Alloying Elements on
temperature behavior. Notch Toughness of Pearlitic Steels,” Transactions of ASM, Vol. 43, 1951.)