
Page 302 - Materials Science and Engineering An Introduction
P. 302
274 • Chapter 8 / Failure
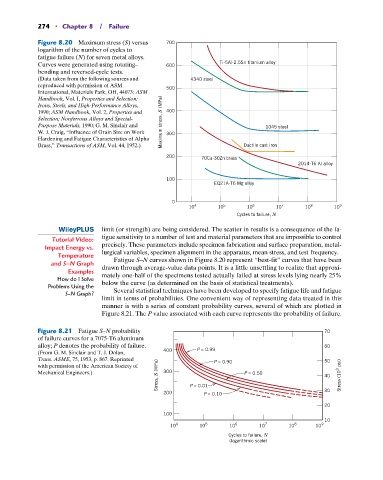
Figure 8.20 Maximum stress (S) versus 700
logarithm of the number of cycles to
fatigue failure (N) for seven metal alloys.
Curves were generated using rotating– 600 Ti-5Al-2.5Sn titanium alloy
bending and reversed-cycle tests.
(Data taken from the following sources and 4340 steel
reproduced with permission of ASM
500
International, Materials Park, OH, 44073: ASM
Handbook, Vol. I, Properties and Selection:
Irons, Steels, and High-Performance Alloys,
1990; ASM Handbook, Vol. 2, Properties and 400
Selection; Nonferrous Alloys and Special-
Purpose Materials, 1990; G. M. Sinclair and Maximum stress, S (MPa) 1045 steel
W. J. Craig, “Influence of Grain Size on Work 300
Hardening and Fatigue Characteristics of Alpha
Brass,” Transactions of ASM, Vol. 44, 1952.) Ductile cast iron
200 70Cu-30Zn brass
2014-T6 Al alloy
100
EQ21A-T6 Mg alloy
0
10 4 10 5 10 6 10 7 10 8 10 9
Cycles to failure, N
limit (or strength) are being considered. The scatter in results is a consequence of the fa-
Tutorial Video: tigue sensitivity to a number of test and material parameters that are impossible to control
Impact Energy vs. precisely. These parameters include specimen fabrication and surface preparation, metal-
Temperature lurgical variables, specimen alignment in the apparatus, mean stress, and test frequency.
Fatigue S–N curves shown in Figure 8.20 represent “best-fit” curves that have been
and S–N Graph drawn through average-value data points. It is a little unsettling to realize that approxi-
Examples mately one-half of the specimens tested actually failed at stress levels lying nearly 25%
How do I Solve below the curve (as determined on the basis of statistical treatments).
Problems Using the Several statistical techniques have been developed to specify fatigue life and fatigue
S–N Graph?
limit in terms of probabilities. One convenient way of representing data treated in this
manner is with a series of constant probability curves, several of which are plotted in
Figure 8.21. The P value associated with each curve represents the probability of failure.
Figure 8.21 Fatigue S–N probability 70
of failure curves for a 7075-T6 aluminum
alloy; P denotes the probability of failure. 60
(From G. M. Sinclair and T. J. Dolan, 400 P = 0.99
Trans. ASME, 75, 1953, p. 867. Reprinted P = 0.90 50
Stress, S (MPa) 40 Stress (10 3 psi)
with permission of the American Society of
Mechanical Engineers.) 300 P = 0.50
200 P = 0.01 30
P = 0.10
20
100
10
10 4 10 5 10 6 10 7 10 8 10 9
Cycles to failure, N
(logarithmic scale)