Page 200 - Mathematical Models and Algorithms for Power System Optimization
P. 200

Discrete Optimization for Reactive Power Planning 191

                                      Table 6.12 Coordination process of Case 1
                         Infeasible State No.    Sum of Infeasibility  New VAR Node Number

                         2,4,5                        0.336                  75
                         2,4,5                        0.136                  99
                         5                            0.093                  99
                         5                            0.060                  110
                         5                            0.046                  99
                         5                            0.011                  123
                         5                           0.00085                 123
                         —                             0.0                   —


                                     Table 6.13 Investment costs of VAR sources
                                                   The Number of   The Number of   Investment Costs
                Cases                Methods       New VAR Node    New VAR Banks    (10,000 yuan)
                1                Decomposition and      10              28              50.8
                                   coordination
                                   Independent          12              46              66.6
                2                Decomposition and      12              40              60.2
                                   coordination
                                   Independent          12              50              70.6


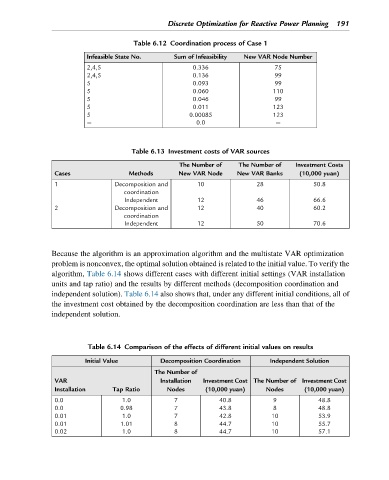
               Because the algorithm is an approximation algorithm and the multistate VAR optimization
               problem is nonconvex, the optimal solution obtained is related to the initial value. To verify the
               algorithm, Table 6.14 shows different cases with different initial settings (VAR installation
               units and tap ratio) and the results by different methods (decomposition coordination and
               independent solution). Table 6.14 also shows that, under any different initial conditions, all of
               the investment cost obtained by the decomposition coordination are less than that of the
               independent solution.


                         Table 6.14 Comparison of the effects of different initial values on results
                         Initial Value       Decomposition Coordination     Independent Solution
                                            The Number of
                VAR                          Installation  Investment Cost The Number of Investment Cost
                Installation    Tap Ratio      Nodes      (10,000 yuan)    Nodes     (10,000 yuan)

                0.0                1.0           7            40.8           9           48.8
                0.0               0.98           7            43.8           8           48.8
                0.01               1.0           7            42.8          10           53.9
                0.01              1.01           8            44.7          10           55.7
                0.02               1.0           8            44.7          10           57.1
   195   196   197   198   199   200   201   202   203   204   205