
Page 197 - Mathematical Models and Algorithms for Power System Optimization
P. 197
188 Chapter 6
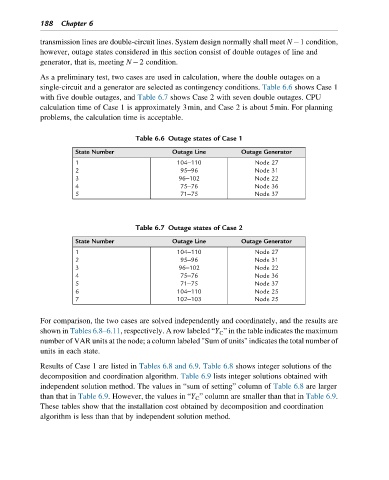
transmission lines are double-circuit lines. System design normally shall meet N 1 condition,
however, outage states considered in this section consist of double outages of line and
generator, that is, meeting N 2 condition.
As a preliminary test, two cases are used in calculation, where the double outages on a
single-circuit and a generator are selected as contingency conditions. Table 6.6 shows Case 1
with five double outages, and Table 6.7 shows Case 2 with seven double outages. CPU
calculation time of Case 1 is approximately 3min, and Case 2 is about 5min. For planning
problems, the calculation time is acceptable.
Table 6.6 Outage states of Case 1
State Number Outage Line Outage Generator
1 104–110 Node 27
2 95–96 Node 31
3 96–102 Node 22
4 75–76 Node 36
5 71–75 Node 37
Table 6.7 Outage states of Case 2
State Number Outage Line Outage Generator
1 104–110 Node 27
2 95–96 Node 31
3 96–102 Node 22
4 75–76 Node 36
5 71–75 Node 37
6 104–110 Node 25
7 102–103 Node 25
For comparison, the two cases are solved independently and coordinately, and the results are
shown in Tables 6.8–6.11, respectively. A row labeled “Y C ” in the table indicates the maximum
number of VAR units at the node; a column labeled "Sum of units" indicates the total number of
units in each state.
Results of Case 1 are listed in Tables 6.8 and 6.9. Table 6.8 shows integer solutions of the
decomposition and coordination algorithm. Table 6.9 lists integer solutions obtained with
independent solution method. The values in “sum of setting” column of Table 6.8 are larger
than that in Table 6.9. However, the values in “Y C ” column are smaller than that in Table 6.9.
These tables show that the installation cost obtained by decomposition and coordination
algorithm is less than that by independent solution method.