
Page 278 - Mathematical Models and Algorithms for Power System Optimization
P. 278
270 Chapter 7
state variable, detailed in Fig. 7.20. Fig. 7.21 shows the actual values, measurements, and
estimates of Δω j .
Actual value
Estimate value
(Both are almost identical)
15–60 75–120 180–195 195–240 255–300
(A)
Actual value
Estimate value
(Both are almost identical)
30–60 90–120 150–180 210–240
(B)
Fig. 7.21
Comparison of actual curve trace, estimated curve and measured curve of Δω.
(A) comparison of Δω of thermal units; (B) comparison of Δω of hydro units.
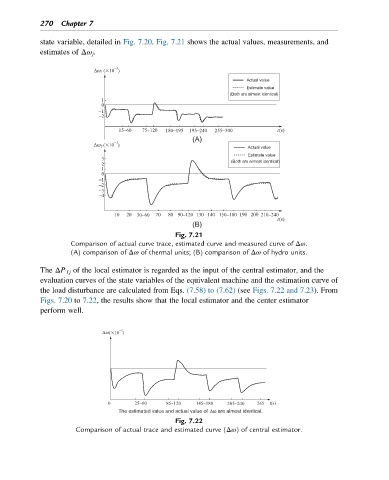
The ΔP Tj of the local estimator is regarded as the input of the central estimator, and the
evaluation curves of the state variables of the equivalent machine and the estimation curve of
the load disturbance are calculated from Eqs. (7.58) to (7.62) (see Figs. 7.22 and 7.23). From
Figs. 7.20 to 7.22, the results show that the local estimator and the center estimator
perform well.
25–60 85–120 145–180 205–240
The estimated value and actual value of Δω are almost identical.
Fig. 7.22
Comparison of actual trace and estimated curve (Δω) of central estimator.