
Page 274 - Mathematical Models and Algorithms for Power System Optimization
P. 274
266 Chapter 7
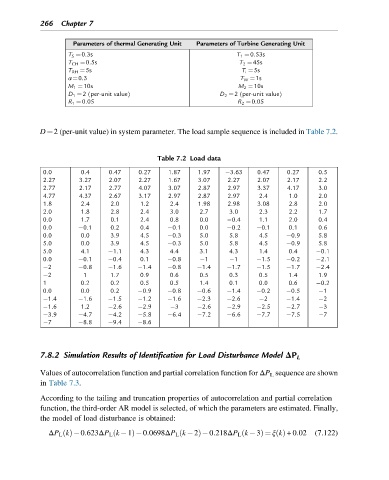
Parameters of thermal Generating Unit Parameters of Turbine Generating Unit
T S ¼0.3s T 1 ¼0.53s
T CH ¼0.5s T 2 ¼45s
T RH ¼5s T i ¼5s
α¼0.3 T W ¼1s
M 1 ¼10s M 2 ¼10s
D 1 ¼2 (per-unit value) D 2 ¼2 (per-unit value)
R 1 ¼0.05 R 2 ¼0.05
D¼2 (per-unit value) in system parameter. The load sample sequence is included in Table 7.2.
Table 7.2 Load data
0.0 0.4 0.47 0.27 1.87 1.97 3.63 0.47 0.27 0.5
2.27 3.27 2.07 2.27 1.67 3.07 2.27 2.07 2.17 2.2
2.77 2.17 2.77 4.07 3.07 2.87 2.97 3.37 4.17 3.0
4.77 4.37 2.67 3.17 2.97 2.87 2.97 2.4 1.0 2.0
1.8 2.4 2.0 1.2 2.4 1.98 2.98 3.08 2.8 2.0
2.0 1.8 2.8 2.4 3.0 2.7 3.0 2.3 2.2 1.7
0.0 1.7 0.1 2.4 0.8 0.0 0.4 1.1 2.0 0.4
0.0 0.1 0.2 0.4 0.1 0.0 0.2 0.1 0.1 0.6
0.0 0.0 3.9 4.5 0.3 5.0 5.8 4.5 0.9 5.8
5.0 0.0 3.9 4.5 0.3 5.0 5.8 4.5 0.9 5.8
5.0 4.1 1.1 4.3 4.4 3.1 4.3 1.4 0.4 0.1
0.0 0.1 0.4 0.1 0.8 1 1 1.5 0.2 2.1
2 0.8 1.6 1.4 0.8 1.4 1.7 1.5 1.7 2.4
2 1 1.7 0.9 0.6 0.5 0.3 0.5 1.4 1.9
1 0.2 0.2 0.5 0.5 1.4 0.1 0.0 0.6 0.2
0.0 0.0 0.2 0.9 0.8 0.6 1.4 0.2 0.5 1
1.4 1.6 1.5 1.2 1.6 2.3 2.6 2 1.4 2
1.6 1.2 2.6 2.9 3 2.6 2.9 2.5 2.7 3
3.9 4.7 4.2 5.8 6.4 7.2 6.6 7.7 7.5 7
7 8.8 9.4 8.6
7.8.2 Simulation Results of Identification for Load Disturbance Model ΔP L
Values of autocorrelation function and partial correlation function for ΔP L sequence are shown
in Table 7.3.
According to the tailing and truncation properties of autocorrelation and partial correlation
function, the third-order AR model is selected, of which the parameters are estimated. Finally,
the model of load disturbance is obtained:
ð
ð
ΔP L kðÞ 0:623ΔP L k 1ð Þ 0:0698ΔP L k 2Þ 0:218ΔP L k 3Þ ¼ ξ kðÞ +0:02 (7.122)