
Page 36 - Mathematical Techniques of Fractional Order Systems
P. 36
26 Mathematical Techniques of Fractional Order Systems
Tumor evolution with and without PK/PD therapy
100
Tumor
90 Tumor with PKPD chemotherapy & anti−resorptive treatment
80
70
Tumor [%] 60
50
40
30
20
10
0
0 500 1000 1500 2000 2500
Time t [days]
100
90
80
Tumor T(t) [%] 60
70
50
40
30
20
10
0
0
0.1
0.2 2000
0.3 1800
0.4 1600
0.5 1200 1400
0.6 1000
0.7 800
0.8 600
Distance - x ∈ [0,1] 0.9 1 0 200 400
Time - t [days]
100 80
Tumor T(t) [%] 60 40
0 20
0
0.1
0.2
0.3
0.4
0.5 4000
3500
0.6 3000
0.7 2000 2500
0.8 1500
Distance - x ∈ [0,1] 0.9 500 1000
1 0 Time - t [days]
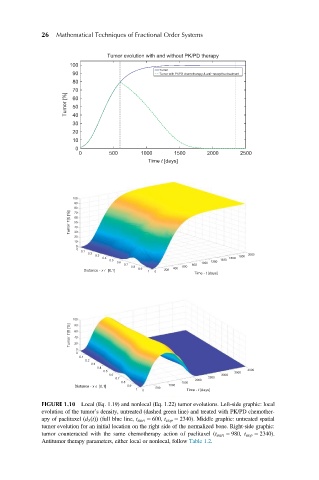
FIGURE 1.10 Local (Eq. 1.19) and nonlocal (Eq. 1.22) tumor evolutions. Left-side graphic: local
evolution of the tumor’s density, untreated (dashed green line) and treated with PK/PD chemother-
apy of paclitaxel ðd 3 ðtÞÞ (full blue line, t start 5 600, t stop 5 2340). Middle graphic: untreated spatial
tumor evolution for an initial location on the right side of the normalized bone. Right-side graphic:
tumor counteracted with the same chemotherapy action of paclitaxel (t start 5 980, t stop 5 2340).
Antitumor therapy parameters, either local or nonlocal, follow Table 1.2.