
Page 230 - Matrix Analysis & Applied Linear Algebra
P. 230
4.6 Classical Least Squares 225
Example 4.6.1
Problem: A small company has been in business for four years and has recorded
annual sales (in tens of thousands of dollars) as follows.
Year 1 2 3 4
Sales 23 27 3034
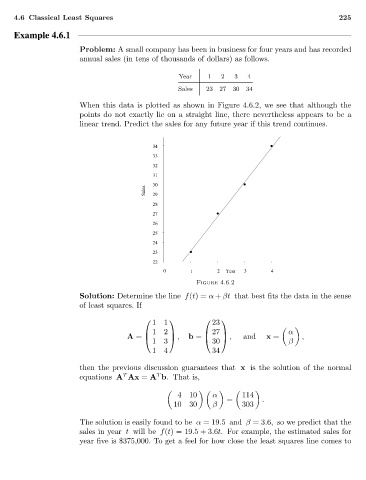
When this data is plotted as shown in Figure 4.6.2, we see that although the
points do not exactly lie on a straight line, there nevertheless appears to be a
linear trend. Predict the sales for any future year if this trend continues.
34
33
32
31
30
Sales 29
28
27
26
25
24
23
22
0 1 2 Year 3 4
Figure 4.6.2
Solution: Determine the line f(t)= α + βt that best fits the data in the sense
of least squares. If
11 23
α
, , and x = ,
12 27
13 b = 30 β
A =
14 34
then the previous discussion guarantees that x is the solution of the normal
T
T
equations A Ax = A b. That is,
410 α 114
10 30 β = 303 .
The solution is easily found to be α =19.5 and β =3.6, so we predict that the
sales in year t will be f(t)=19.5+3.6t. For example, the estimated sales for
year five is $375,000. To get a feel for how close the least squares line comes to