
Page 334 - Matrix Analysis & Applied Linear Algebra
P. 334
330 Chapter 5 Norms, Inner Products, and Orthogonality
More generally, if the coordinates of each of the ten vertices in View (a) are
placed as columns in a vertex matrix,
v 1 v 2 v 10 ˆ v 1 ˆ v 2 ˆ v 10
↓ ↓ ↓ ↓ ↓ ↓
x 1 x 2 ··· x 10 ˆ x 1 ˆ x 2 ˆ
··· x 10
y 2 y 10 ˆ y 1 ˆ y 2 ··· ˆ y 10
V a = y 1 ··· , then V d = P z P y P x V a =
z 1 z 2 ··· z 10 ˆ z 1 ˆ z 2 ··· ˆ z 10
is the vertex matrix for the orientation shown in View (d). The polytope in
View (d) is drawn by identifying pairs of vertices (v i , v j )in V a that have an
edge between them, and by drawing an edge between the corresponding vertices
(ˆ v i , ˆ v j )in V d .
Example 5.6.5
3-D Computer Graphics. Consider the problem of displaying and manipu-
lating views of a three-dimensional solid on a two-dimensional computer display
monitor. One simple technique is to use a wire-frame representation of the solid
consisting of a mesh of points (vertices) on the solid’s surface connected by
straight line segments (edges). Once these vertices and edges have been defined,
the resulting polytope can be oriented in any desired manner as described in
Example 5.6.4, so all that remains are the following problems.
Problem: How should the vertices and edges of a three-dimensional polytope
be plotted on a two-dimensional computer monitor?
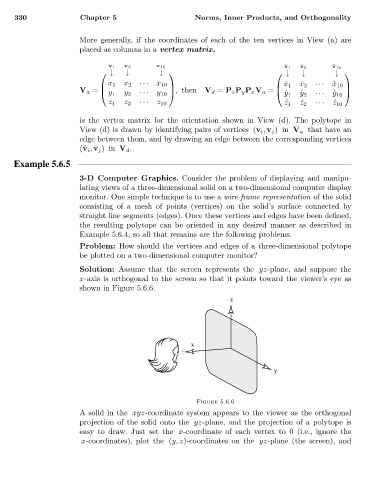
Solution: Assume that the screen represents the yz-plane, and suppose the
x-axis is orthogonal to the screen so that it points toward the viewer’s eye as
shown in Figure 5.6.6.
z
x
y
Figure 5.6.6
A solid in the xyz-coordinate system appears to the viewer as the orthogonal
projection of the solid onto the yz-plane, and the projection of a polytope is
easy to draw. Just set the x-coordinate of each vertex to 0 (i.e., ignore the
x-coordinates), plot the (y, z)-coordinates on the yz-plane (the screen), and