
Page 120 - Mechanical Engineers' Handbook (Volume 2)
P. 120
7 Resistance Bridge Transducer Measurement System Considerations 109
1. Performing a frequency analysis of the signal recorded with no power supplied to
determine 1
2. Applying power under normal operating conditions and comparing signal frequency
content to the results of 1 to determine 2
An example follows where noise is present as a self-generating response and the bridge is
powered first by a dc supply and then by an ac supply.
In this example, the non-self-generating response (signal) occurs at frequency and
p
the self-generating response (noise) occurs at two frequencies bracketing ( /2 and
p
a
p
3 ). Figure 29 illustrates the wave shapes assumed for the self-generating and non-self-
a
generating responses with dc power supplied ( 0). Figure 29a represents both self-
3
generating response input and output, Fig. 29b represents non-self-generating response input
and output, and Fig. 29c represents the total transducer output (summation of 29a and 29b).
It is seen that the two responses are hopelessly intermingled and that the signal cannot be
separated from the noise. Figure 30 shows the frequency content of the wave shapes, with
Fig. 30a corresponding to 29a, Fig. 30b corresponding to 29b, and Fig. 30c corresponding
to 29c. The ac-powered bridge will be presented as a solution to measurement problems
such as this. Frequency is typically selected as 10 times .
p
3
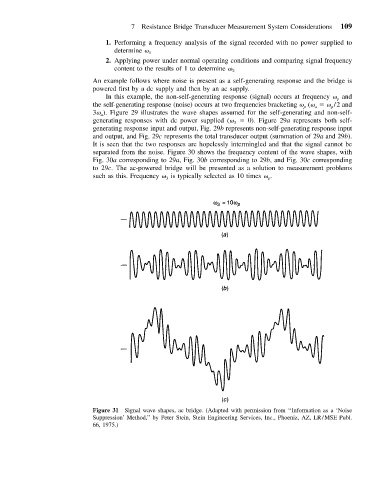
Figure 31 Signal wave shapes, ac bridge. (Adapted with permission from ‘‘Information as a ‘Noise
Suppression’ Method,’’ by Peter Stein, Stein Engineering Services, Inc., Phoeniz, AZ, LR/MSE Publ.
66, 1975.)