
Page 121 - Mechanical Engineers' Handbook (Volume 2)
P. 121
110 Bridge Transducers
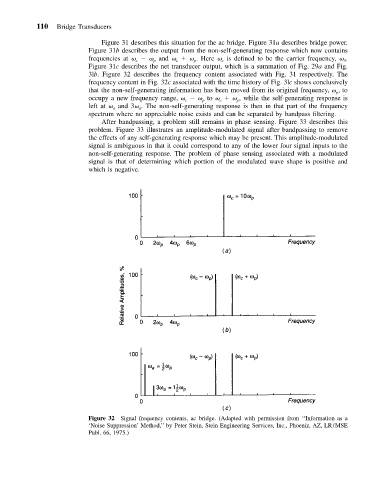
Figure 31 describes this situation for the ac bridge. Figure 31a describes bridge power.
Figure 31b describes the output from the non-self-generating response which now contains
frequencies at and . Here is defined to be the carrier frequency, .
3
p
c
c
p
c
Figure 31c describes the net transducer output, which is a summation of Fig. 29a and Fig.
3lb. Figure 32 describes the frequency content associated with Fig. 31 respectively. The
frequency content in Fig. 32c associated with the time history of Fig. 3lc shows conclusively
that the non-self-generating information has been moved from its original frequency, ,to
p
occupy a new frequency range, to , while the self-generating response is
p
c
p
c
left at and 3 . The non-self-generating response is then in that part of the frequency
a
a
spectrum where no appreciable noise exists and can be separated by bandpass filtering.
After bandpassing, a problem still remains in phase sensing. Figure 33 describes this
problem. Figure 33 illustrates an amplitude-modulated signal after bandpassing to remove
the effects of any self-generating response which may be present. This amplitude-modulated
signal is ambiguous in that it could correspond to any of the lower four signal inputs to the
non-self-generating response. The problem of phase sensing associated with a modulated
signal is that of determining which portion of the modulated wave shape is positive and
which is negative.
Figure 32 Signal frequency contents, ac bridge. (Adapted with permission from ‘‘Information as a
‘Noise Suppression’ Method,’’ by Peter Stein, Stein Engineering Services, Inc., Phoeniz, AZ, LR/MSE
Publ. 66, 1975.)