
Page 525 - Mechanical Engineers' Handbook (Volume 2)
P. 525
516 Control System Performance Modification
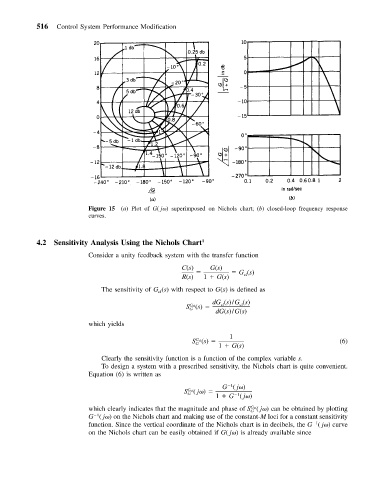
Figure 15 (a) Plot of G( j ) superimposed on Nichols chart; (b) closed-loop frequency response
curves.
4.2 Sensitivity Analysis Using the Nichols Chart 1
Consider a unity feedback system with the transfer function
C(s) G(s)
G (s)
R(s) 1 G(s) cl
The sensitivity of G (s) with respect to G(s) is defined as
cl
dG (s)/G (s)
S (s) cl cl
G cl
G
dG(s)/G(s)
which yields
1
S (s) (6)
G cl
G
1 G(s)
Clearly the sensitivity function is a function of the complex variable s.
To design a system with a prescribed sensitivity, the Nichols chart is quite convenient.
Equation (6) is written as
G ( j )
1
S ( j )
G cl
G
1
1 G ( j )
which clearly indicates that the magnitude and phase of S ( j ) can be obtained by plotting
G cl
G
1
G ( j ) on the Nichols chart and making use of the constant-M loci for a constant sensitivity
1
function. Since the vertical coordinate of the Nichols chart is in decibels, the G ( j ) curve
on the Nichols chart can be easily obtained if G( j ) is already available since