
Page 522 - Mechanical Engineers' Handbook (Volume 2)
P. 522
4 Nichols Chart 513
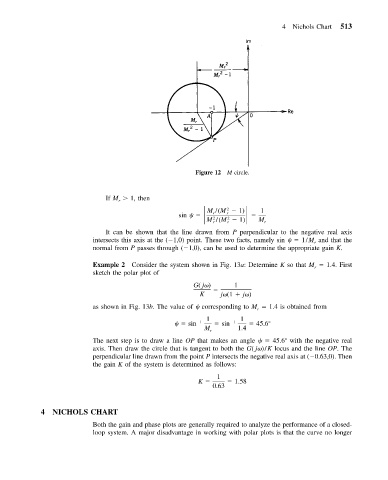
Figure 12 M circle.
If M 1, then
r
sin M /(M 1) 1
2
r
r
2
M /(M 1) M r
2
r
r
It can be shown that the line drawn from P perpendicular to the negative real axis
intersects this axis at the ( 1,0) point. These two facts, namely sin 1/M and that the
r
normal from P passes through ( 1,0), can be used to determine the appropriate gain K.
Example 2 Consider the system shown in Fig. 13a: Determine K so that M 1.4. First
r
sketch the polar plot of
G( j ) 1
K j (1 j )
as shown in Fig. 13b. The value of corresponding to M 1.4 is obtained from
r
1 1
sin 1 sin 1 45.6
M r 1.4
The next step is to draw a line OP that makes an angle 45.6 with the negative real
axis. Then draw the circle that is tangent to both the G( j )/K locus and the line OP. The
perpendicular line drawn from the point P intersects the negative real axis at ( 0.63,0). Then
the gain K of the system is determined as follows:
1
K 1.58
0.63
4 NICHOLS CHART
Both the gain and phase plots are generally required to analyze the performance of a closed-
loop system. A major disadvantage in working with polar plots is that the curve no longer