
Page 523 - Mechanical Engineers' Handbook (Volume 2)
P. 523
514 Control System Performance Modification
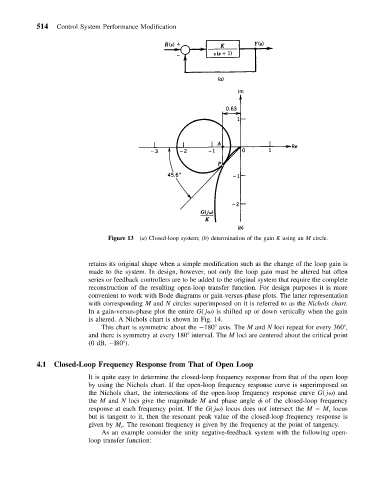
Figure 13 (a) Closed-loop system; (b) determination of the gain K using an M circle.
retains its original shape when a simple modification such as the change of the loop gain is
made to the system. In design, however, not only the loop gain must be altered but often
series or feedback controllers are to be added to the original system that require the complete
reconstruction of the resulting open-loop transfer function. For design purposes it is more
convenient to work with Bode diagrams or gain-versus-phase plots. The latter representation
with corresponding M and N circles superimposed on it is referred to as the Nichols chart.
In a gain-versus-phase plot the entire G( j ) is shifted up or down vertically when the gain
is altered. A Nichols chart is shown in Fig. 14.
This chart is symmetric about the 180 axis. The M and N loci repeat for every 360 ,
and there is symmetry at every 180 interval. The M loci are centered about the critical point
(0 dB, l80 ).
4.1 Closed-Loop Frequency Response from That of Open Loop
It is quite easy to determine the closed-loop frequency response from that of the open loop
by using the Nichols chart. If the open-loop frequency response curve is superimposed on
the Nichols chart, the intersections of the open-loop frequency response curve G( j ) and
the M and N loci give the magnitude M and phase angle of the closed-loop frequency
response at each frequency point. If the G( j ) locus does not intersect the M M locus
r
but is tangent to it, then the resonant peak value of the closed-loop frequency response is
given by M . The resonant frequency is given by the frequency at the point of tangency.
r
As an example consider the unity negative-feedback system with the following open-
loop transfer function: