
Page 524 - Mechanical Engineers' Handbook (Volume 2)
P. 524
4 Nichols Chart 515
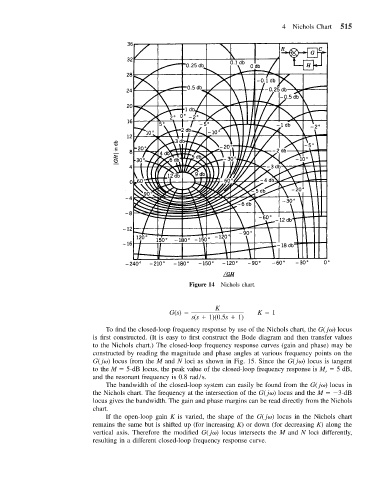
Figure 14 Nichols chart.
K
G(s) K 1
s(s 1)(0.5s 1)
To find the closed-loop frequency response by use of the Nichols chart, the G( j ) locus
is first constructed. (It is easy to first construct the Bode diagram and then transfer values
to the Nichols chart.) The closed-loop frequency response curves (gain and phase) may be
constructed by reading the magnitude and phase angles at various frequency points on the
G( j ) locus from the M and N loci as shown in Fig. 15. Since the G( j ) locus is tangent
to the M 5-dB locus, the peak value of the closed-loop frequency response is M 5 dB,
r
and the resonant frequency is 0.8 rad/s.
The bandwidth of the closed-loop system can easily be found from the G( j ) locus in
the Nichols chart. The frequency at the intersection of the G( j ) locus and the M 3-dB
locus gives the bandwidth. The gain and phase margins can be read directly from the Nichols
chart.
If the open-loop gain K is varied, the shape of the G( j ) locus in the Nichols chart
remains the same but is shifted up (for increasing K) or down (for decreasing K) along the
vertical axis. Therefore the modified G( j ) locus intersects the M and N loci differently,
resulting in a different closed-loop frequency response curve.