
Page 62 - Mechanical Engineers' Handbook (Volume 2)
P. 62
4 Operating Point of Static Systems 51
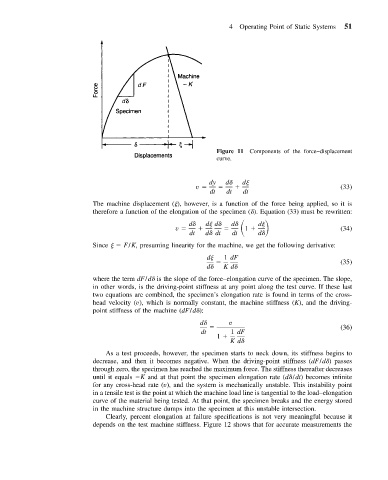
Figure 11 Components of the force–displacement
curve.
dy d d
v (33)
dt dt dt
The machine displacement ( ), however, is a function of the force being applied, so it is
therefore a function of the elongation of the specimen ( ). Equation (33) must be rewritten:
d d d 1
d
d
v (34)
dt d dt dt d
Since F/K, presuming linearity for the machine, we get the following derivative:
d 1 dF
(35)
d Kd
where the term dF/d is the slope of the force–elongation curve of the specimen. The slope,
in other words, is the driving-point stiffness at any point along the test curve. If these last
two equations are combined, the specimen’s elongation rate is found in terms of the cross-
head velocity (v), which is normally constant, the machine stiffness (K), and the driving-
point stiffness of the machine (dF/d ):
d v
(36)
dt 1 dF
1
Kd
As a test proceeds, however, the specimen starts to neck down, its stiffness begins to
decrease, and then it becomes negative. When the driving-point stiffness (dF/d ) passes
through zero, the specimen has reached the maximum force. The stiffness thereafter decreases
until it equals K and at that point the specimen elongation rate (d /dt) becomes infinite
for any cross-head rate (v), and the system is mechanically unstable. This instability point
in a tensile test is the point at which the machine load line is tangential to the load–elongation
curve of the material being tested. At that point, the specimen breaks and the energy stored
in the machine structure dumps into the specimen at this unstable intersection.
Clearly, percent elongation at failure specifications is not very meaningful because it
depends on the test machine stiffness. Figure 12 shows that for accurate measurements the