
Page 115 - Mechanics Analysis Composite Materials
P. 115
100 Mechanics and analysis of composite materials
;6-,
ZOO0 - /
/
/
1600 - / /
/
0 OA 0.8 1.2 1.6
(a)
,6;
/
/
/
200 /
/
/
,
/
0 I 2 3
(b)
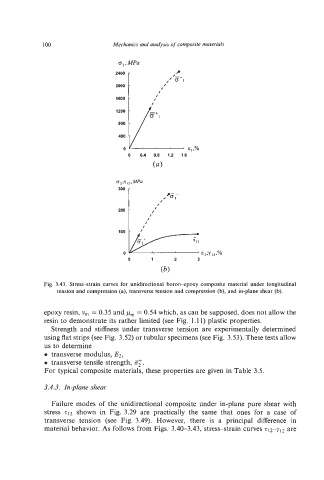
Fig. 3.43. Stress-strain curves for unidirectional boron-epoxy composite material under longitudinal
tension and compression (a), transverse tension and compression (b), and in-plane shear (b).
epoxy resin, vm = 0.35 and p, = 0.54 which, as can be supposed, does not allow the
resin to demonstrate its rather limited (see Fig. 1.1 1) plastic properties.
Strength and stiffness under transverse tension are experimentally determined
using flat strips (see Fig. 3.52) or tubular specimens(see Fig. 3.53). These tests allow
us to determine
0 transverse modulus, E2,
0 transverse tensile strength, 8;.
For typical composite materials, these properties are given in Table 3.5.
3.4.3. In-plane shear
Failure modes of the unidirectional composite under in-plane pure shear with
stress 212 shown in Fig. 3.29 are practically the same that ones for a case of
transverse tension (see Fig. 3.49). However, there is a principal difference in
material behavior. As follows from Figs. 3.40-3.43, stress-strain curves ~12-y~~are