
Page 307 - Mechanics of Asphalt Microstructure and Micromechanics
P. 307
Applications of Discrete Element Method 299
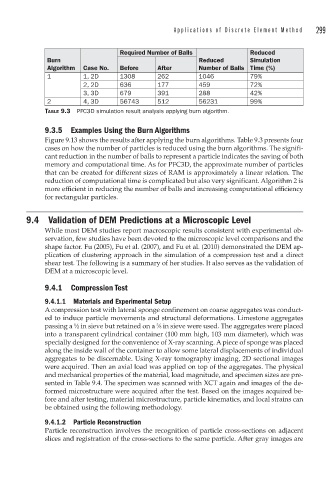
Required Number of Balls Reduced
Burn Reduced Simulation
Algorithm Case No. Before After Number of Balls Time (%)
1 1, 2D 1308 262 1046 79%
2, 2D 636 177 459 72%
3, 3D 679 391 288 42%
2 4, 3D 56743 512 56231 99%
TABLE 9.3 PFC3D simulation result analysis applying burn algorithm.
9.3.5 Examples Using the Burn Algorithms
Figure 9.13 shows the results after applying the burn algorithms. Table 9.3 presents four
cases on how the number of particles is reduced using the burn algorithms. The signifi-
cant reduction in the number of balls to represent a particle indicates the saving of both
memory and computational time. As for PFC3D, the approximate number of particles
that can be created for different sizes of RAM is approximately a linear relation. The
reduction of computational time is complicated but also very significant. Algorithm 2 is
more efficient in reducing the number of balls and increasing computational efficiency
for rectangular particles.
9.4 Validation of DEM Predictions at a Microscopic Level
While most DEM studies report macroscopic results consistent with experimental ob-
servation, few studies have been devoted to the microscopic level comparisons and the
shape factor. Fu (2005), Fu et al. (2007), and Fu et al. (2010) demonstrated the DEM ap-
plication of clustering approach in the simulation of a compression test and a direct
shear test. The following is a summary of her studies. It also serves as the validation of
DEM at a microscopic level.
9.4.1 Compression Test
9.4.1.1 Materials and Experimental Setup
A compression test with lateral sponge confinement on coarse aggregates was conduct-
ed to induce particle movements and structural deformations. Limestone aggregates
3
passing a ½ in sieve but retained on a ⁄8 in sieve were used. The aggregates were placed
into a transparent cylindrical container (100 mm high, 103 mm diameter), which was
specially designed for the convenience of X-ray scanning. A piece of sponge was placed
along the inside wall of the container to allow some lateral displacements of individual
aggregates to be discernable. Using X-ray tomography imaging, 2D sectional images
were acquired. Then an axial load was applied on top of the aggregates. The physical
and mechanical properties of the material, load magnitude, and specimen sizes are pre-
sented in Table 9.4. The specimen was scanned with XCT again and images of the de-
formed microstructure were acquired after the test. Based on the images acquired be-
fore and after testing, material microstructure, particle kinematics, and local strains can
be obtained using the following methodology.
9.4.1.2 Particle Reconstruction
Particle reconstruction involves the recognition of particle cross-sections on adjacent
slices and registration of the cross-sections to the same particle. After gray images are