
Page 311 - Mechanics of Asphalt Microstructure and Micromechanics
P. 311
Applications of Discrete Element Method 303
Where Δh, h = vertical displacement and the height of the specimen; Δr, r = displace-
ment in the radial direction and the radius of the specimen.
The global volumetric strain is defined as:
ε = ε + ε + ε = ε + 2 ε (9-28)
V 1 2 3 1 3
The global volumetric strain can also be calculated from the sum of weighted local
volumetric strain by the following equation:
V ∑
ε =
ε = V fi Vi ∑ V ε ( l + ε + ε ) (9-29)
'
l
l
l
fi i 1 i 2 i 3
'
where e V = global volumetric strain calculated from local volume strain
V fi = volumetric fraction of each local volume to the total volume
l
e i = local strain in tetrahedron i
By comparing the global volumetric strain calculated by direct measurements and
that calculated by weighted local volumetric strains, the local strain quantification
methodology can be evaluated.
9.4.1.6 Analysis of Experimental Results
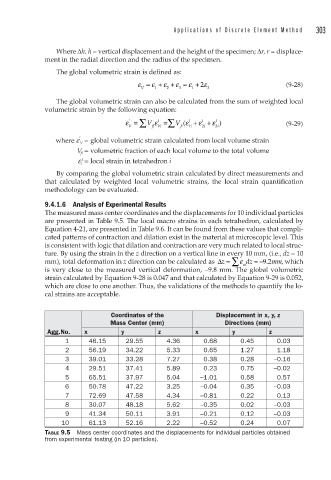
The measured mass center coordinates and the displacements for 10 individual particles
are presented in Table 9.5. The local macro strains in each tetrahedron, calculated by
Equation 4-21, are presented in Table 9.6. It can be found from these values that compli-
cated patterns of contraction and dilation exist in the material at microscopic level. This
is consistent with logic that dilation and contraction are very much related to local struc-
ture. By using the strain in the z direction on a vertical line in every 10 mm, (i.e., dz = 10
mm), total deformation in z direction can be calculated as Δz = ∑ ε zi dz = −92. mm, which
is very close to the measured vertical deformation, −9.8 mm. The global volumetric
strain calculated by Equation 9-28 is 0.047 and that calculated by Equation 9-29 is 0.052,
which are close to one another. Thus, the validations of the methods to quantify the lo-
cal strains are acceptable.
Coordinates of the Displacement in x, y, z
Mass Center (mm) Directions (mm)
Agg.No. x y z x y z
1 46.15 29.55 4.36 0.68 0.45 0.03
2 56.19 34.22 5.33 0.65 1.27 1.18
3 39.01 33.28 7.27 0.38 0.28 –0.16
4 29.51 37.41 5.89 0.23 0.75 –0.02
5 65.51 37.97 5.04 –1.01 0.58 0.57
6 50.78 47.22 3.25 –0.04 0.35 –0.03
7 72.69 47.58 4.34 –0.81 0.22 0.13
8 30.07 48.18 5.62 –0.35 0.02 –0.03
9 41.34 50.11 3.91 –0.21 0.12 –0.03
10 61.13 52.16 2.22 –0.52 0.24 0.07
TABLE 9.5 Mass center coordinates and the displacements for individual particles obtained
from experimental testing (in 10 particles).