
Page 313 - Mechanics of Asphalt Microstructure and Micromechanics
P. 313
Applications of Discrete Element Method 305
Z
Y
X
a. Experimental observation b. Simulation using irregular particles c. Simulation using spheres
FIGURE 9.16 Illustration of particle translational movements.
lation. An axial force was applied directly on the load plate. The physical properties of
particles, boundary, and compact force were assigned similar to those in the confined
compression test.
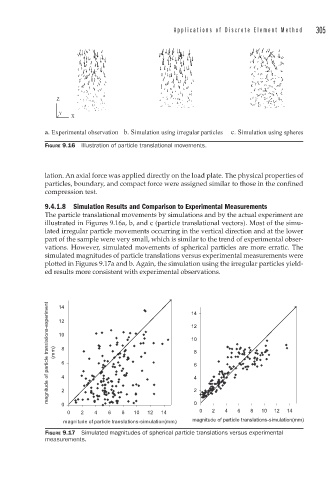
9.4.1.8 Simulation Results and Comparison to Experimental Measurements
The particle translational movements by simulations and by the actual experiment are
illustrated in Figures 9.16a, b, and c (particle translational vectors). Most of the simu-
lated irregular particle movements occurring in the vertical direction and at the lower
part of the sample were very small, which is similar to the trend of experimental obser-
vations. However, simulated movements of spherical particles are more erratic. The
simulated magnitudes of particle translations versus experimental measurements were
plotted in Figures 9.17a and b. Again, the simulation using the irregular particles yield-
ed results more consistent with experimental observations.
magnitude of particle translations-experiment (mm) 12 8 6 4 14 8 6 4
14
12
10
10
0 2 2 0
0 2 4 6 8 10 12 14
0 2 4 6 8 10 12 14
magnitude of particle translations-simulation(mm)
magnitude of particle translations-simulation(mm)
FIGURE 9.17 Simulated magnitudes of spherical particle translations versus experimental
measurements.