
Page 314 - Mechanics of Asphalt Microstructure and Micromechanics
P. 314
306 Ch a p t e r N i n e
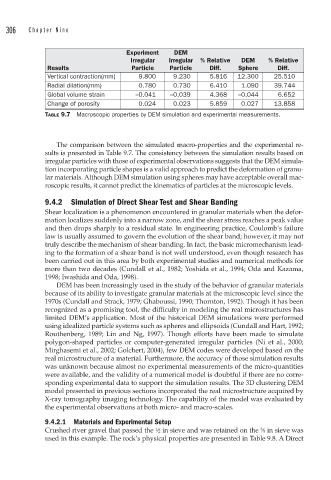
Experiment DEM
Irregular Irregular % Relative DEM % Relative
Results Particle Particle Diff. Sphere Diff.
Vertical contraction(mm) 9.800 9.230 5.816 12.300 25.510
Radial dilation(mm) 0.780 0.730 6.410 1.090 39.744
Global volume strain –0.041 –0.039 4.368 –0.044 6.652
Change of porosity 0.024 0.023 5.859 0.027 13.858
TABLE 9.7 Macroscopic properties by DEM simulation and experimental measurements.
The comparison between the simulated macro-properties and the experimental re-
sults is presented in Table 9.7. The consistency between the simulation results based on
irregular particles with those of experimental observations suggests that the DEM simula-
tion incorporating particle shapes is a valid approach to predict the deformation of granu-
lar materials. Although DEM simulation using spheres may have acceptable overall mac-
roscopic results, it cannot predict the kinematics of particles at the microscopic levels.
9.4.2 Simulation of Direct Shear Test and Shear Banding
Shear localization is a phenomenon encountered in granular materials when the defor-
mation localizes suddenly into a narrow zone, and the shear stress reaches a peak value
and then drops sharply to a residual state. In engineering practice, Coulomb’s failure
law is usually assumed to govern the evolution of the shear band; however, it may not
truly describe the mechanism of shear banding. In fact, the basic micromechanism lead-
ing to the formation of a shear band is not well understood, even though research has
been carried out in this area by both experimental studies and numerical methods for
more than two decades (Cundall et al., 1982; Yoshida et al., 1994; Oda and Kazama,
1998; Iwashida and Oda, 1998).
DEM has been increasingly used in the study of the behavior of granular materials
because of its ability to investigate granular materials at the microscopic level since the
1970s (Cundall and Strack, 1979; Ghaboussi, 1990; Thornton, 1992). Though it has been
recognized as a promising tool, the difficulty in modeling the real microstructures has
limited DEM’s application. Most of the historical DEM simulations were performed
using idealized particle systems such as spheres and ellipsoids (Cundall and Hart, 1992;
Routhenberg, 1989; Lin and Ng, 1997). Though efforts have been made to simulate
polygon-shaped particles or computer-generated irregular particles (Ni et al., 2000;
Mirghasemi et al., 2002; Golchert, 2004), few DEM codes were developed based on the
real microstructure of a material. Furthermore, the accuracy of those simulation results
was unknown because almost no experimental measurements of the micro-quantities
were available, and the validity of a numerical model is doubtful if there are no corre-
sponding experimental data to support the simulation results. The 3D clustering DEM
model presented in previous sections incorporated the real microstructure acquired by
X-ray tomography imaging technology. The capability of the model was evaluated by
the experimental observations at both micro- and macro-scales.
9.4.2.1 Materials and Experimental Setup
3
Crushed river gravel that passed the ½ in sieve and was retained on the ⁄8 in sieve was
used in this example. The rock’s physical properties are presented in Table 9.8. A Direct