
Page 318 - Mechanics of Asphalt Microstructure and Micromechanics
P. 318
310 Ch a p t e r N i n e
DEM-Irregular % Relative % Relative
Results Experiment Particle Difference DEM-Sphere Difference
Vertical dilation
(mm) 5.00 4.50 10.00% –3.70 174.00%
Change of porosity 0.02 0.02 10.44% –0.02 175.99%
Peak shear force 63.47 67.63 6.55% 41.85 34.06%
Residue shear
force 21.60 25.31 17.18% 32.77 51.71%
Peak friction angle 40.15 40.51 0.90% 39.96 0.48%
Residue friction
angle 34.26 32.55 5.00% 30.84 9.99%
TABLE 9.10 Global macro-properties of experimental measurement and simulations.
9.4.2.4 Macro-Behavior: Simulation Results and Experimental Measurements
The simulations predicted both macro-properties and micro-properties of the assem-
blies. The global macro-properties discussed in this study were related to the features of
the entire specimen such as the shear strength, global deformation, and bulk friction
angle. The local macro-properties included the characteristics monitored in the local
volumes, which were either tetrahedron formed by every four adjacent particles or the
measuring layers in the specimen. The micro-properties included the kinematics and
contacts of individual particles. The comparisons of global macro-properties between
the experimental measurements and simulation results are presented in Table 9.10. The
comparisons of other properties are referred to in Fu et al. (2010).
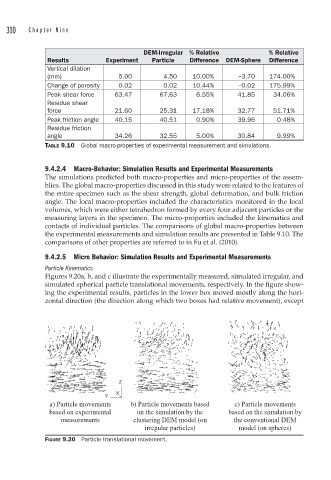
9.4.2.5 Micro Behavior: Simulation Results and Experimental Measurements
Particle Kinematics
Figures 9.20a, b, and c illustrate the experimentally measured, simulated irregular, and
simulated spherical particle translational movements, respectively. In the figure show-
ing the experimental results, particles in the lower box moved mostly along the hori-
zontal direction (the direction along which two boxes had relative movement), except
Z
X
Y
a) Particle movements b) Particle movements based c) Particle movements
based on experimental on the simulation by the based on the simulation by
measurements clustering DEM model (on the conventional DEM
irregular particles) model (on spheres)
FIGURE 9.20 Particle translational movement.