
Page 315 - Mechanics of Asphalt Microstructure and Micromechanics
P. 315
Applications of Discrete Element Method 307
Agg. Young’s
Agg. Specific Modulus Poisson’s Porosity
Material Size(mm) Gravity (Gpa) Ratio Weight(g) (%)
Crushed river gravel 9.5~12.7 2.528 60 0.2 1878 44.4
TABLE 9.8 Physical properties of the material.
Shear Apparatus EL28-007 was utilized for the test. Normal forces applied were 20 N
(Newton), 120 N, 320 N, and 520 N, respectively. The displacement rate was 0.12 mm/s.
A shear box with a size of 5 5 2.5 in (127 127 63.5 mm) was specially built
for the test. It was made from plexiglass which can be penetrated easily by X-rays (Fig-
ure 9.18a). Aggregates were placed into the shear box and compacted by a 5-pound
compact hammer until the desired unit weight was obtained. A normal force was then
applied on top of the specimen. The top box was fixed, and the bottom box was pushed
horizontally. The relative lateral displacement and shear force between the two boxes
were monitored automatically during shearing by a data acquisition system: Wave
book/512 TM 12-bit 1MHZ. The maximum relative displacement between the top box
and the bottom box is 9 mm.
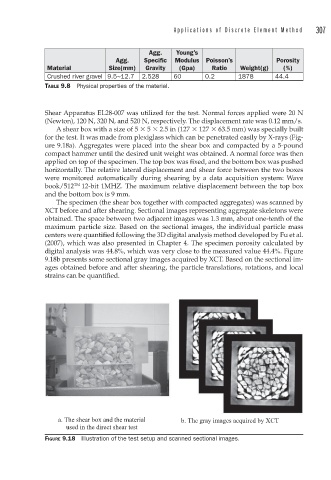
The specimen (the shear box together with compacted aggregates) was scanned by
XCT before and after shearing. Sectional images representing aggregate skeletons were
obtained. The space between two adjacent images was 1.3 mm, about one-tenth of the
maximum particle size. Based on the sectional images, the individual particle mass
centers were quantified following the 3D digital analysis method developed by Fu et al.
(2007), which was also presented in Chapter 4. The specimen porosity calculated by
digital analysis was 44.8%, which was very close to the measured value 44.4%. Figure
9.18b presents some sectional gray images acquired by XCT. Based on the sectional im-
ages obtained before and after shearing, the particle translations, rotations, and local
strains can be quantified.
a. The shear box and the material b. The gray images acquired by XCT
used in the direct shear test
FIGURE 9.18 Illustration of the test setup and scanned sectional images.