
Page 379 - Mechanics of Asphalt Microstructure and Micromechanics
P. 379
Simulation of Asphalt Compaction 371
Lab Compaction Curve of Two Mixes
25
20
15
%Gmm
10
5
0
1 10 100 1000
No. of Gyrations
Mix A Mix B
FIGURE 11.5 Compaction of two different mixes.
Future research on the characterization of K g ,K m , and K b through analyzing experimental
data, micromechanics models, and computational simulation is a viable topic.
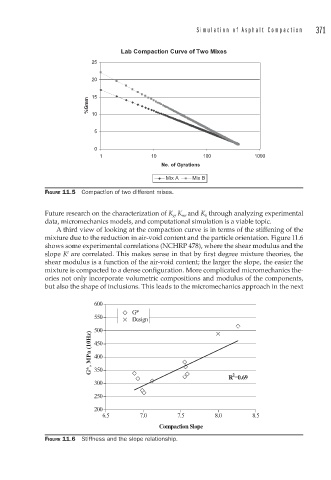
A third view of looking at the compaction curve is in terms of the stiffening of the
mixture due to the reduction in air-void content and the particle orientation. Figure 11.6
shows some experimental correlations (NCHRP 478), where the shear modulus and the
l
slope K are correlated. This makes sense in that by first degree mixture theories, the
shear modulus is a function of the air-void content; the larger the slope, the easier the
mixture is compacted to a dense configuration. More complicated micromechanics the-
ories not only incorporate volumetric compositions and modulus of the components,
but also the shape of inclusions. This leads to the micromechanics approach in the next
600
G*
550 Design
500
G*, MPa (10Hz) 450
400
350
2
R =0.69
300
250
200
6.5 7.0 7.5 8.0 8.5
Compaction Slope
FIGURE 11.6 Stiffness and the slope relationship.