
Page 414 - Mechatronics for Safety, Security and Dependability in a New Era
P. 414
Ch80-I044963.fm Page 398 Tuesday, August 1, 2006 4:54 PM
Ch80-I044963.fm
398
398 Page 398 Tuesday, August 1, 2006 4:54 PM
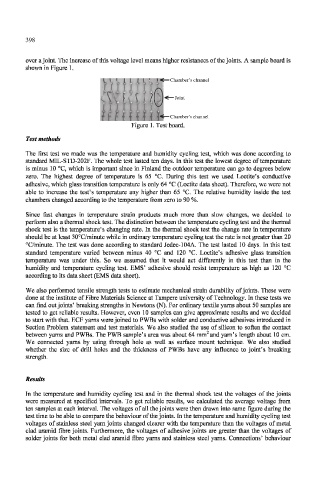
over a joint. The increase of this voltage level means higher resistances of the joints. A sample board is
shown in Figure 1.
Chamber’s channel
- Chamber's channel
HI H
Joint
• Joint
Chamber’s channel
Chamber's channel
Figure 1. Test board.
Test methods
The first test we made was the temperature and humidity cycling test, which was done according to
standard MIL-STD-202F. The whole test lasted ten days. In this test the lowest degree of temperature
is minus 10 °C, which is important since in Finland the outdoor temperature can go to degrees below
zero. The highest degree of temperature is 65 °C. During this test we used Loctite's conductive
adhesive, which glass transition temperature is only 64 °C (Loctite data sheet). Therefore, we were not
able to increase the test's temperature any higher than 65 °C. The relative humidity inside the test
chambers changed according to the temperature from zero to 90 %.
Since fast changes in temperature strain products much more than slow changes, we decided to
perform also a thermal shock test. The distinction between the temperature cycling test and the thermal
shock test is the temperature's changing rate. In the thermal shock test the change rate in temperature
should be at least 30°C/minute while in ordinary temperature cycling test the rate is not greater than 20
°C/minute. The test was done according to standard Jedec-104A. The test lasted 10 days. In this test
standard temperature varied between minus 40 °C and 120 °C. Loctite's adhesive glass transition
temperature was under this. So we assumed that it would act differently in this test than in the
humidity and temperature cycling test. EMS' adhesive should resist temperature as high as 120 °C
according to its data sheet (EMS data sheet).
We also performed tensile strength tests to estimate mechanical strain durability of joints. These were
done at the institute of Fibre Materials Science at Tampere university of Technology. In these tests we
can find out joints' breaking strengths in Newtons (N). For ordinary textile yarns about 50 samples are
tested to get reliable results. However, even 10 samples can give approximate results and we decided
to start with that. ECF yarns were joined to PWBs with solder and conductive adhesives introduced in
Section Problem statement and test materials. We also studied the use of silicon to soften the contact
between yarns and PWBs. The PWB sample's area was about 64 mm and yam's length about 10 cm.
We connected yarns by using through hole as well as surface mount technique. We also studied
whether the size of drill holes and the thickness of PWBs have any influence to joint's breaking
strength.
Results
In the temperature and humidity cycling test and in the thermal shock test the voltages of the joints
were measured at specified intervals. To get reliable results, we calculated the average voltage from
ten samples at each interval. The voltages of all the joints were then drawn into same figure during the
test time to be able to compare the behaviour of the joints. In the temperature and humidity cycling test
voltages of stainless steel yarn joints changed clearer with the temperature than the voltages of metal
clad aramid fibre joints. Furthermore, the voltages of adhesive joints are greater than the voltages of
solder joints for both metal clad aramid fibre yarns and stainless steel yarns. Connections' behaviour