
Page 267 - Membranes for Industrial Wastewater Recovery and Re-Use
P. 267
2 36 Membranes for Industrial Wastewater Recovery and Re-use
AUD$180 000 ($13 3 5 60) was required to upgrade the throughput from 2.5
M1 d-lto3.75Ml d-linDecember1998.
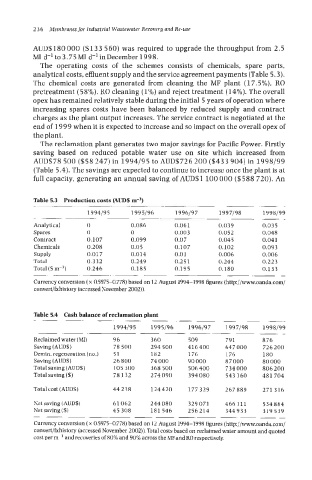
The operating costs of the schemes consists of chemicals, spare parts,
analytical costs, effluent supply and the service agreement payments (Table 5.3).
The chemical costs are generated from cleaning the MF plant (17.5%), RO
pretreatment (58%), RO cleaning (1%) and reject treatment (1 4%). The overall
opex has remained relatively stable during the initial 5 years of operation where
increasing spares costs have been balanced by reduced supply and contract
charges as the plant output increases. The service contract is negotiated at the
end of 1999 when it is expected to increase and so impact on the overall opex of
the plant.
The reclamation plant generates two major savings for Pacific Power. Firstly
saving based on reduced potable water use on site which increased from
AUDS78 500 ($58 247) in 1994/95 to AUD$726 200 ($433 904) in 1998199
(Table 5.4). The savings are expected to continue to increase once the plant is at
full capacity, generating an annual saving of AUD$1 100000 ($588 720). An
Table 5.3 Production costs (AUDS m-3)
199419 5 1995196 1996/97 1997/98 1998/99
Analytical 0 0.086 0.061 0.039 0.035
Spares 0 0 0.003 0.052 0.048
Contract 0.107 0.099 0.07 0.045 0.041
Chemicals 0.208 0.05 0.107 0.102 0.093
Supply 0.017 0.014 0.01 0.006 0.006
Total 0.332 0.249 0.251 0.244 0.223
Total ($ m-3) 0.246 0.185 0.195 0.180 0.133
~
Currency conversion (x 0.5975-0.778) based on 12 August 1994-1998 figures (http://www.oanda.com/
convert/fxhistory (accessed November 2002)).
Table 5.4 Cash balance of reclamation plant
1994/95 1995/96 1996/97 1997/98 1998199
Reclaimed water (Ml) 96 360 509 79 1 876
Saving (AUDS) 78 500 294 500 416400 647 000 726 200
Demin. regeneration (no.) 51 182 176 176 180
Saving (AIJDS) 26 800 74 000 90 000 8 7 000 80 000
Total saving (AUDS) 105 300 368 500 506 400 734 000 806 200
Total saving ($) 78 132 2 74 090 394080 543 160 481 704
Total cost (AUD$) 44238 124420 177329 267889 271316
Net saving (AUD$) 61 062 244080 329071 466111 534884
Net saving (S) 45 308 181 546 256214 344933 319 539
~-
Currency conversion (x 0.5975-0.778) based on 12 August 1994-1998 figures (http://www.oanda.com/
convert/fxhistory (accessed November 2002)). Total costs based on reclaimed water amount and quoted
cost per m-3 and recoveries of 80% and 90% across the MFand RO respectively