
Page 210 -
P. 210
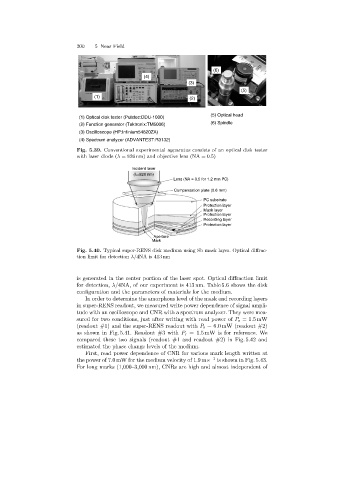
200   5 Near Field


                                                                            (6)
                                                   (4)
                                                                   (3)
                                                                                      (5)
                                  (1)                               (2)


                                                                           (5) Optical head
                             (1) Optical disk tester (Pulstec:DDU-1000)
                             (2) Function generator (Tektronix:TM5006)     (6) Spindle
                             (3) Oscilloscope (HP:Infinium54820ZA)
                             (4) Spectrum analyzer (ADVANTEST:R3132)
                            Fig. 5.39. Conventional experimental apparatus consists of an optical disk tester
                            with laser diode (λ = 826 nm)and objective lens (NA = 0.5)

                                               Incident laser
                                                (l=826 nm)
                                                              Lens (NA = 0.5 for 1.2 mm PC)
                                                              Compensation plate (0.6 mm)

                                                                        PC substrate
                                                                        Protection layer
                                                                        Mask layer
                                                                        Protection layer
                                                                        Recording layer
                                                                        Protection layer

                                                       Aperture
                                                      Mark
                            Fig. 5.40. Typical super-RENS disk medium using Sb mask layer. Optical diffrac-
                            tion limit for detection λ/4NA is 413 nm


                            is generated in the center portion of the laser spot. Optical diffraction limit
                            for detection, λ/4NA, of our experiment is 413 nm. Table 5.6 shows the disk
                            configuration and the parameters of materials for the medium.
                               In order to determine the amorphous level of the mask and recordinglayers
                            in super-RENS readout, we measured write power dependence of signal ampli-
                            tude with an oscilloscope and CNR with a spectrum analyzer. They were mea-
                            sured for two conditions, just after writingwith read power of P r =1.5mW
                            (readout #1) and the super-RENS readout with P r =6.0 mW (readout #2)
                            as shown in Fig. 5.41. Readout #3 with P r =1.5 mW is for reference. We
                            compared these two signals (readout #1 and readout #2) in Fig. 5.42 and
                            estimated the phase change levels of the medium.
                               First, read power dependence of CNR for various mark length written at
                            the power of 7.0 mW for the medium velocity of 1.9ms −1  is shown in Fig. 5.43.
                            For longmarks (1,000–3,000 nm), CNRs are high and almost independent of