
Page 212 -
P. 212
202 5 Near Field
40 Mark length 3,000 nm
2,000
30 1,000
CNR (dB) 20 500
10 400 300
200
0
1 2 3 4 5 6 7
Read power P (mW)
r
Fig. 5.43. Read power dependence of CNR for various mark lengths written at
power of 7.0 mW for medium velocity of 1.9ms −1
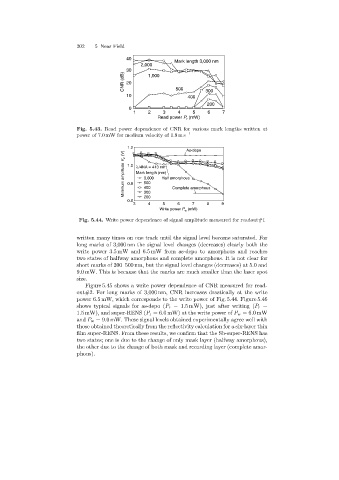
1.2 As-depo
Minimum amplitude V 2 (V) 1.0 l/4NA = 413 nm
Mark length (nm)
Half amorphous
3,000
500
0.8
400
200
0.6 300 Complete amorphous
3 4 5 6 7 8 9
Write power P (mW)
w
Fig. 5.44. Write power dependence of signal amplitude measured for readout#1
written many times on one track until the signal level become saturated. For
long marks of 3,000 nm the signal level changes (decreases) clearly both the
write power 3.5 mW and 6.5 mW from as-depo to amorphous and reaches
two states of halfway amorphous and complete amorphous. It is not clear for
short marks of 200–500 nm, but the signal level changes (decreases) at 5.0 and
9.0 mW. This is because that the marks are much smaller than the laser spot
size.
Figure 5.45 shows a write power dependence of CNR measured for read-
out#2. For longmarks of 3,000 nm, CNR increases drastically at the write
power 6.5 mW, which corresponds to the write power of Fig. 5.44. Figure 5.46
shows typical signals for as-depo (P r =1.5 mW), just after writing(P r =
1.5 mW), and super-RENS (P r =6.0 mW) at the write power of P w =6.0mW
and P w =9.0 mW. These signal levels obtained experimentally agree well with
those obtained theoretically from the reflectivity calculation for a six-layer thin
film super-RENS. From these results, we confirm that the Sb-super-RENS has
two states; one is due to the change of only mask layer (halfway amorphous),
the other due to the change of both mask and recording layer (complete amor-
phous).