
Page 216 -
P. 216
206 5 Near Field
Table 5.7. Parameters of materials for super-RENS disk using AgO mask layer
x
layer material thickness (nm)phase optical constant
n k
substrate PC 0.6 × 10 6 – 1.56 0
protective layer ZnSiO 2 170 – 2.25 0.01
mask layer AgOx 15 AgO 2 28 0.08
Ag particle 0.04 6.99
protective layer ZnSiO 2 30 – 2.25 0.01
recording layer GeSbTe 15 crystal 4.29 2.09
amorphous 3.97 4.41
protective layer ZnSiO 2 20 – 2.25 0.01
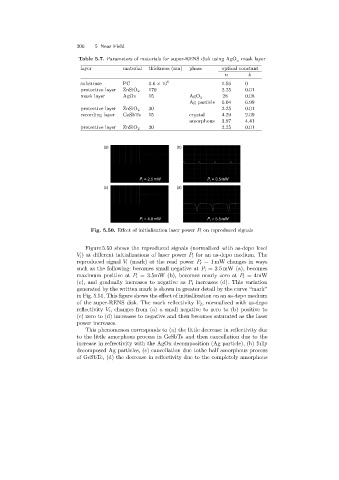
(a) (b)
P = 2.5 mW P = 3.5 mW
i i
(c) (d)
P = 4.0 mW P i = 5.5 mW
i
Fig. 5.50. Effect of initialization laser power P i on reproduced signals
Figure 5.50 shows the reproduced signals (normalized with as-depo level
V i ) at different initializations of laser power P i for an as-depo medium. The
reproduced signal V i (mark) at the read power P r = 1 mW changes in ways
such as the following: becomes small negative at P i =2.5 mW (a), becomes
maximum positive at P i =3.5mW (b), becomes nearly zero at P i = 4mW
(c), and gradually increases to negative as P i increases (d). This variation
generated by the written mark is shown in greater detail by the curve “mark”
in Fig. 5.51. This figure shows the effect of initiallization on an as-depo medium
of the super-RENS disk. The mark reflectivity V 2 , normalized with as-depo
reflectivity V i , changes from (a) a small negative to zero to (b) positive to
(c) zero to (d) increases to negative and then becomes saturated as the laser
power increases.
This phenomenon corresponds to (a) the little decrease in reflectivity due
to the little amorphous process in GeSbTe and then cancellation due to the
increase in refrectivity with the AgOx decomposition (Ag particle), (b) fully
decomposed Agparticles, (c) cancellation due tothe half amorphous process
of GeSbTe, (d) the decrease in reflectivity due to the completely amorphous