
Page 218 -
P. 218
208 5 Near Field
(a)
40
= 0 mW
P i
30 3,000 nm
CNR (dB) 20 400
10
300
0
1 2 3 4 5 6 7 8 9
Laser power Pw (mW)
(b)
50
P = 3.5 mW
40 i 3,000 nm
CNR (dB) 30 400
20
10 300
200
0
1 2 3 4 5 6 7 8 9
Laser power Pw (mW)
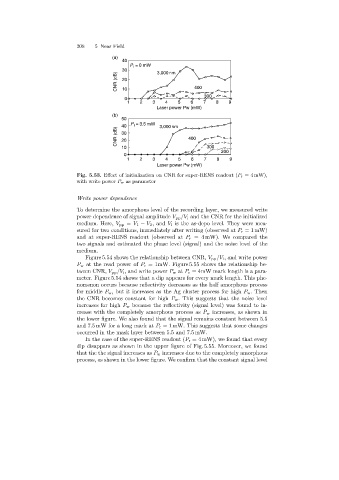
Fig. 5.53. Effect of initialization on CNR for super-RENS readout (P r =4 mW),
with write power P w as parameter
Write power dependence
To determine the amorphous level of the recordinglayer, we measured write
power dependence of signal amplitude V pp /V i and the CNR for the initialized
medium. Here, V pp = V 1 − V 2 ,and V i is the as-depo level. They were mea-
sured for two conditions, immediately after writing(observed at P r =1 mW)
and at super-RENS readout (observed at P r = 4 mW). We compared the
two signals and estimated the phase level (signal) and the noise level of the
medium.
Figure 5.54 shows the relationship between CNR, V pp /V i , and write power
P w at the read power of P r = 1mW. Figure 5.55 shows the relationship be-
tween CNR, V pp /V i , and write power P w at P r = 4mW mark length is a para-
meter. Figure 5.54 shows that a dip appears for every mark length. This phe-
nomenon occurs because reflectivity decreases as the half amorphous process
for middle P w , but it increases as the Agcluster process for high P w . Then
the CNR becomes constant for high P w . This suggests that the noise level
increases for high P w because the reflectivity (signal level) was found to in-
crease with the completely amorphous process as P w increases, as shown in
the lower figure. We also found that the signal remains constant between 5.5
and 7.5 mW for a longmark at P r = 1 mW. This suggests that some changes
occurred in the mask layer between 5.5 and 7.5 mW.
In the case of the super-RENS readout (P r = 4 mW), we found that every
dip disappars as shown in the upper figure of Fig. 5.55. Moreover, we found
that the the signal increases as P w increases due to the completely amorphous
process, as shown in the lower figure. We confirm that the constant signal level