
Page 220 -
P. 220
210 5 Near Field
50
3,000 nm
40 2,000
1,000
CNR (dB) 30 600 500
20
400
300
10
l/4NA = 413 nm
200
0
1 2 3 4 5 6 7 8 9
Read power P r (mW)
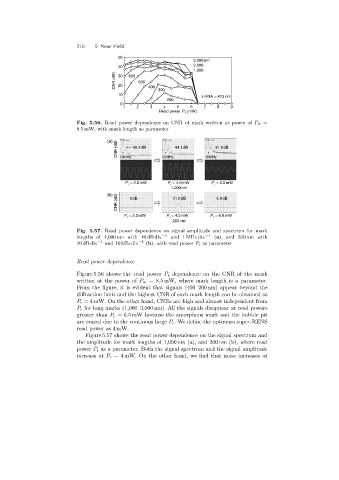
Fig. 5.56. Read power dependence on CNR of mark written at power of P w =
8.5 mW, with mark length as parameter
(a)
CNR (dB) 0 MHz 46.4 dB 0 MHz 44.1 dB 0 MHz 31.6 dB
P = 2.0 mW P = 4.0 mW P = 6.0 mW
r
r
r
1,000 nm
(b) 0dB 11.6 dB 3.9 dB
CNR (dB)
= 2.0 mW P = 4.0 mW P = 6.0 mW
P r
r r
200 nm
Fig. 5.57. Read power dependence on signal amplitude and spectrum for mark
lengths of 1,000 nm with 10 dB div −1 and 1 MHz div −1 (a), and 200 nm with
10 dB div −1 and 10 kHz div −1 (b),withreadpower P r as parameter
Read power dependence
Figure 5.56 shows the read power P r dependence on the CNR of the mark
written at the power of P w =8.5 mW, where mark length is a parameter.
From the figure, it is evident that signals (400–200 nm) appear beyond the
diffraction limit and the highest CNR of each mark length can be obtained at
P r = 4 mW. On the other hand, CNRs are high and almost independent from
P r for longmarks (1,000–3,000 nm). All the signals disappear at read powers
greater than P r =6.5 mW because the amorphous mark and the bubble pit
are erased due to the continous large P r . We define the optimum super-RENS
read power as 4 mW.
Figure 5.57 shows the read power dependence on the signal spectrum and
the amplitude for mark lengths of 1,000 nm (a), and 200 nm (b), where read
power P r as a parameter. Both the signal spectrum and the signal amplitude
increase at P r = 4 mW. On the other hand, we find that noise increases at