
Page 219 -
P. 219
5.4 Future Applications 209
50 3,000 nm
2,000
40
1,000
CNR (dB) 30 600
20
500
10
0
1 2 3 4 5 6 7 8 9
Write power P (mW) 3,000 nm
w
Signal amp. (Vpp/Vi) 30 2,000
40
20
1,000
10
0
500
4
1
2
3
6
5
(mW) 7 8 9 600
Write power P w
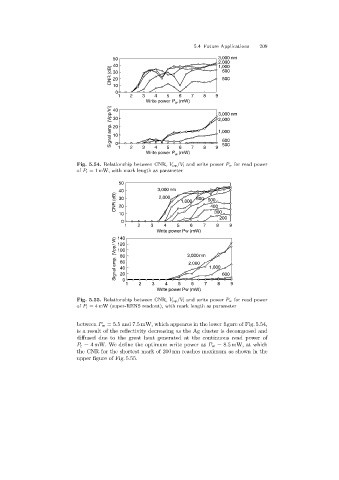
Fig. 5.54. Relationship between CNR, V pp/V i and write power P w for read power
of P r = 1 mW, with mark length as parameter
50
40 3,000 nm
CNR (dB) 30 2,000 1,000 600 500
20
400
10 300
200
0
1 2 3 4 5 6 7 8 9
Write power Pw (mW)
140
Signal amp. (Vpp/ Vi) 100 3,000 nm 1,000
120
80
60
2,000
40
20
0
1 2 3 4 5 6 7 8 600 9
Write power Pw (mW)
Fig. 5.55. Relationship between CNR, V pp/V i and write power P w for read power
of P r = 4 mW (super-RENS readout), with mark length as parameter
between P w =5.5 and 7.5 mW, which appeares in the lower figure of Fig. 5.54,
is a result of the reflectivity decreasingas the Agcluster is decomposed and
diffused due to the great heat generated at the continuous read power of
P r = 4 mW. We define the optimum write power as P w =8.5 mW, at which
the CNR for the shortest mark of 200 nm reaches maximum as shown in the
upper figure of Fig. 5.55.