Page 389 - Microsensors, MEMS and Smart Devices - Gardner Varadhan and Awadelkarim
P. 389
APPLICATIONS     369

  to Equation (13.20),  the  strain sensitivity of  the  system is  estimated  to  be  an impressive
  2  x  10 —5  per  phase  degree.


  13.4.1.2  Calibration

  The  calibration  was  done  on  an  uniform  cantilever  beam.  The  sensor  was  glued  to  a
  fibreglass  cantilever  beam  of  length  172 mm,  width 25  mm  and  thickness  1.5 mm.  The
  centre  of  the  piezoelectric  wafer  is  53.3  mm  from  the  root  of  the  beam  and  the  SAW
  propagating direction is along the beam length. In order to reduce the effect  of the substrate
  in  the  deformation of  the  structure, a relatively  soft  plastic  epoxy was  used  to mount the
  sensor  substrate.  The  softness  of  the  bonding  layer  and  the  wall  of  the  package  of  the
  sensor make the strain on the crystal wafer surface less than the strain on the beam surface.
  Therefore,  a calibration is required  to determine  the actual  sensitivity  of the sensor to the
  strain  on  the  beam surface.
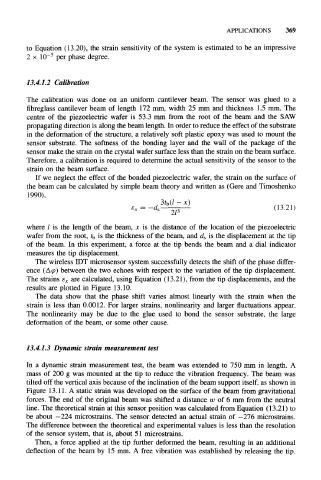
     If  we  neglect  the  effect  of  the  bonded  piezoelectric  wafer,  the  strain  on the  surface of
  the beam can be calculated by  simple beam theory and written as (Gere and Timoshenko
  1990),
                                     ., 3r b(/ - *)
                                 = -d s——3                            (13.21)
                               £ x
  where  /  is  the  length  of  the  beam,  jc is  the  distance  of  the  location  of  the  piezoelectric
  wafer  from  the root,  ^  is the thickness  of the beam,  and d s  is the displacement  at the tip
  of  the  beam.  In  this  experiment,  a  force  at  the  tip  bends  the  beam  and  a  dial  indicator
  measures  the tip  displacement.
    The wireless IDT microsensor  system successfully detects the  shift  of the phase  differ-
  ence      between  the two  echoes  with respect  to the  variation  of the  tip  displacement.
              are calculated, using Equation (13.21), from  the tip displacements, and the
  The strains s x
  results  are plotted  in Figure  13.10.
    The  data  show  that  the  phase  shift  varies  almost  linearly  with  the  strain  when  the
  strain  is  less  than  0.0012.  For  larger  strains,  nonlinearity and  larger  fluctuations  appear.
  The  nonlinearity  may  be  due  to  the  glue  used  to  bond  the  sensor  substrate,  the  large
  deformation  of  the  beam,  or  some  other  cause.


  13.4.1.3  Dynamic strain measurement test

  In  a  dynamic  strain  measurement  test,  the  beam  was  extended  to  750 mm  in  length. A
  mass  of  200 g  was  mounted at  the  tip  to reduce  the  vibration  frequency. The  beam  was
  tilted off the vertical axis because of the inclination of the beam support itself, as shown in
  Figure  13.11.  A static strain was developed  on the surface of the beam from  gravitational
  forces.  The  end  of the  original  beam  was  shifted a distance  w  of 6  mm from  the  neutral
  line. The theoretical  strain at this sensor position was calculated  from  Equation  (13.21) to
  be  about  —224  microstrains.  The  sensor  detected  an  actual  strain  of  —276  microstrains.
  The difference between the theoretical  and experimental  values is less than the resolution
  of  the  sensor  system, that is,  about 51  microstrains.
    Then,  a force  applied  at  the  tip  further  deformed  the  beam,  resulting  in  an  additional
  deflection  of  the  beam  by  15 mm.  A  free  vibration was  established  by  releasing  the  tip.

