
Page 427 - Microsensors, MEMS and Smart Devices - Gardner Varadhan and Awadelkarim
P. 427
TESTING OF A MEMS-IDT ACCELEROMETER 407
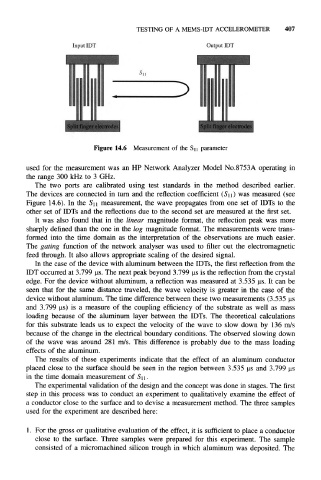
Figure 14.6 Measurement of the S 11 parameter
used for the measurement was an HP Network Analyzer Model No.8753A operating in
the range 300 kHz to 3 GHz.
The two ports are calibrated using test standards in the method described earlier.
The devices are connected in turn and the reflection coefficient (S 11 ) was measured (see
Figure 14.6). In the S 11 measurement, the wave propagates from one set of IDTs to the
other set of IDTs and the reflections due to the second set are measured at the first set.
It was also found that in the linear magnitude format, the reflection peak was more
sharply defined than the one in the log magnitude format. The measurements were trans-
formed into the time domain as the interpretation of the observations are much easier.
The gating function of the network analyser was used to filter out the electromagnetic
feed through. It also allows appropriate scaling of the desired signal.
In the case of the device with aluminum between the IDTs, the first reflection from the
IDT occurred at 3.799 us. The next peak beyond 3.799 us is the reflection from the crystal
edge. For the device without aluminum, a reflection was measured at 3.535 us. It can be
seen that for the same distance traveled, the wave velocity is greater in the case of the
device without aluminum. The time difference between these two measurements (3.535 us
and 3.799 us) is a measure of the coupling efficiency of the substrate as well as mass
loading because of the aluminum layer between the IDTs. The theoretical calculations
for this substrate leads us to expect the velocity of the wave to slow down by 136 m/s
because of the change in the electrical boundary conditions. The observed slowing down
of the wave was around 281 m/s. This difference is probably due to the mass loading
effects of the aluminum.
The results of these experiments indicate that the effect of an aluminum conductor
placed close to the surface should be seen in the region between 3.535 us and 3.799 us
in the time domain measurement of S 11.
The experimental validation of the design and the concept was done in stages. The first
step in this process was to conduct an experiment to qualitatively examine the effect of
a conductor close to the surface and to devise a measurement method. The three samples
used for the experiment are described here:
1. For the gross or qualitative evaluation of the effect, it is sufficient to place a conductor
close to the surface. Three samples were prepared for this experiment. The sample
consisted of a micromachined silicon trough in which aluminum was deposited. The