
Page 424 - Microsensors, MEMS and Smart Devices - Gardner Varadhan and Awadelkarim
P. 424
404 MEMS-IDT MICROSENSORS
1 c 2
V
^
r- ^ ^
s u>r > k S 22
_ ^ ^
— ^
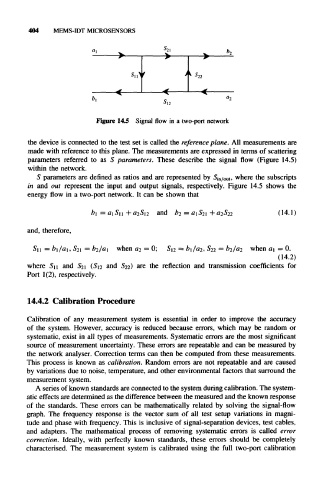
Figure 14.5 Signal flow in a two-port network
the device is connected to the test set is called the reference plane. All measurements are
made with reference to this plane. The measurements are expressed in terms of scattering
parameters referred to as 5 parameters. These describe the signal flow (Figure 14.5)
within the network.
5 parameters are defined as ratios and are represented by Sin/out, where the subscripts
in and out represent the input and output signals, respectively. Figure 14.5 shows the
energy flow in a two-port network. It can be shown that
b 1 = a 1S 11 + a 2S 12 and b 2 = a 1S 21 + a 2S 22 (14.1)
and, therefore,
S 11 = b 1/a 1, S 21 = b 2/a 1 when a 2 = 0; S 12 = b 1 /a 2 , S 22 = b 2/a 2 when a 1 = 0.
(14.2)
where S 11 and S 21 (S 12 and S 22) are the reflection and transmission coefficients for
Port 1(2), respectively.
14.4.2 Calibration Procedure
Calibration of any measurement system is essential in order to improve the accuracy
of the system. However, accuracy is reduced because errors, which may be random or
systematic, exist in all types of measurements. Systematic errors are the most significant
source of measurement uncertainty. These errors are repeatable and can be measured by
the network analyser. Correction terms can then be computed from these measurements.
This process is known as calibration. Random errors are not repeatable and are caused
by variations due to noise, temperature, and other environmental factors that surround the
measurement system.
A series of known standards are connected to the system during calibration. The system-
atic effects are determined as the difference between the measured and the known response
of the standards. These errors can be mathematically related by solving the signal-flow
graph. The frequency response is the vector sum of all test setup variations in magni-
tude and phase with frequency. This is inclusive of signal-separation devices, test cables,
and adapters. The mathematical process of removing systematic errors is called error
correction. Ideally, with perfectly known standards, these errors should be completely
characterised. The measurement system is calibrated using the full two-port calibration