
Page 165 - MODELING OF ASPHALT CONCRETE
P. 165
Interr elationships among Asphalt Concr ete Stif fnesses 143
Power-Law Representations
Various forms of power-law expressions have been used to represent the viscoelastic
response. Usually, those representations, although rough and simplistic, yield fits that
are globally smooth and stable (Park et al. 1996).
Presented below are some of the common power-law expressions commonly used
in fitting viscoelastic response functions. Although the expressions are presented for
D(t), they can similarly apply to E(t).
Pure Power Law
The pure power law (PPL) is the simplest among all power-law representations; it is
given by the following form:
Dt () = D t n (6-13)
1
where the constant D is the value of the creep compliance at t = 1 and the exponent n is
1
obtained by identifying the representative slope of the experimental data over the
transient region plotted on a log-log scale. The limitation of the PPL is its inability of
representing the data in regions other than the transient zone (Park and Kim 1996).
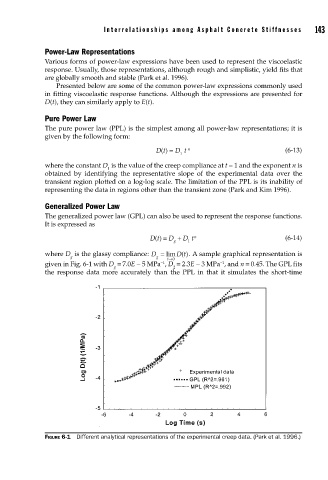
Generalized Power Law
The generalized power law (GPL) can also be used to represent the response functions.
It is expressed as
Dt () = D + D t n (6-14)
1
g
where D is the glassy compliance: D = lim ( . A sample graphical representation is
D t)
g g
t→0
given in Fig. 6-1 with D = 7.0E − 5 MPa , D = 2.3E − 3 MPa , and n = 0.45. The GPL fits
−1
−1
g 2
the response data more accurately than the PPL in that it simulates the short-time
FIGURE 6-1 Different analytical representations of the experimental creep data. (Park et al. 1996.)