
Page 166 - MODELING OF ASPHALT CONCRETE
P. 166
144 Cha pte r S i x
behavior more realistically due to the presence of the factor D ; however, it fails to
g
simulate the data at long times.
Modified Power Law
The representation of the modified power law (MPL) (Williams 1964) is of the following
form:
D − D
Dt() = D + e g n
g
⎛ ⎜ ⎝ 1 + τ ⎞ ⎟ (6-15)
t ⎠
−1
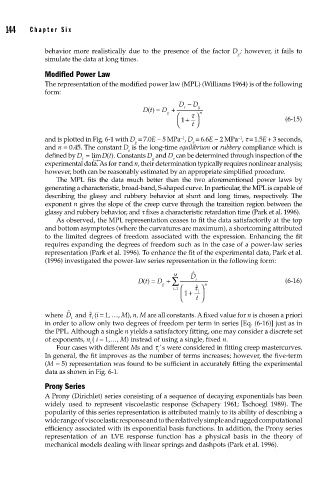
and is plotted in Fig. 6-1 with D = 7.0E − 5 MPa , D = 6.6E − 2 MPa , t = 1.5E + 3 seconds,
−1
g e
and n = 0.45. The constant D is the long-time equilibrium or rubbery compliance which is
e
defined by D = lim (
D t). Constants D and D can be determined through inspection of the
e t→∞ g e
experimental data. As for t and n, their determination typically requires nonlinear analysis;
however, both can be reasonably estimated by an appropriate simplified procedure.
The MPL fits the data much better than the two aforementioned power laws by
generating a characteristic, broad-band, S-shaped curve. In particular, the MPL is capable of
describing the glassy and rubbery behavior at short and long times, respectively. The
exponent n gives the slope of the creep curve through the transition region between the
glassy and rubbery behavior, and t fixes a characteristic retardation time (Park et al. 1996).
As observed, the MPL representation ceases to fit the data satisfactorily at the top
and bottom asymptotes (where the curvatures are maximum), a shortcoming attributed
to the limited degrees of freedom associated with the expression. Enhancing the fit
requires expanding the degrees of freedom such as in the case of a power-law series
representation (Park et al. 1996). To enhance the fit of the experimental data, Park et al.
(1996) investigated the power-law series representation in the following form:
ˆ
M
Dt() = D + ∑ D i (6-16)
g n
ˆ ⎞
i ⎛ τ
=1
i
⎜ ⎝ 1 + t ⎠ ⎟
ˆ
where D and ˆ τ (i = 1, …, M), n, M are all constants. A fixed value for n is chosen a priori
i
i
in order to allow only two degrees of freedom per term in series [Eq. (6-16)] just as in
the PPL. Although a single n yields a satisfactory fitting, one may consider a discrete set
of exponents, n ( i = 1,…, M) instead of using a single, fixed n.
i
Four cases with different Ms and t ’ s were considered in fitting creep mastercurves.
i
In general, the fit improves as the number of terms increases; however, the five-term
(M = 5) representation was found to be sufficient in accurately fitting the experimental
data as shown in Fig. 6-1.
Prony Series
A Prony (Dirichlet) series consisting of a sequence of decaying exponentials has been
widely used to represent viscoelastic response (Schapery 1961; Tschoegl 1989). The
popularity of this series representation is attributed mainly to its ability of describing a
wide range of viscoelastic response and to the relatively simple and rugged computational
efficiency associated with its exponential basis functions. In addition, the Prony series
representation of an LVE response function has a physical basis in the theory of
mechanical models dealing with linear springs and dashpots (Park et al. 1996).