
Page 37 - Modelling in Transport Phenomena A Conceptual Approach
P. 37
18 CHAPTER 2. MOLECULAR AND CONVECTIVE TRANSPORT
b) hm Eq. (2.1-2)
Substitution of the values into Eq. (1) gives
(i)(4 x 10⁻³)
v2 = 0.1 - = - 0.3m/s
io x 10-3
The minus sign indicates that the upper plate moves in the negative x-direction.
Note that the velocity gradient is dvxldy = - 100s-l.
c) Since the momentum flux is the same irrespective of the fluid, ryx = 1 Pa.
x
(~(4 10-3)
= 0.1 - = - 3.9m/s (3)
1 x 10⁻³
The velocity gradient in this me is dv,ldy = - 1000 s-l.
Comment: Viscosity is a measure of the ability of the fluid to transfer momen-
tum. Therefore, the decrease in viscosity causes a steeper velocity gradient.
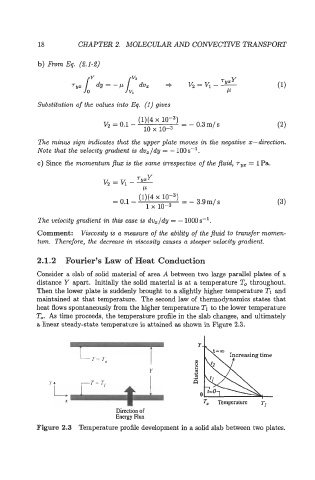
2.1.2 Fourier's Law of Heat Conduction
Consider a slab of solid material of area A between two large parallel plates of a
distance Y apart. Initially the solid material is at a temperature To throughout.
Then the lower plate is suddenly brought to a slightly higher temperature TI and
maintained at that temperature. The second law of thermodynamics states that
heat flows spontaneously from the higher temperature 2'1 to the lower temperature
To. As time proceeds, the temperature profile in the slab changes, and ultimately
a linear steady-state temperature is attained as shown in Figure 2.3.
Increasing time
c
To Temperature T,
Direction of
Energy Flux
Figure 2.3 Temperature profile development in a solid slab between two plates.