Page 42 - Modelling in Transport Phenomena A Conceptual Approach
P. 42

2.1.  MOLECULAR TRANSPORT                                            23
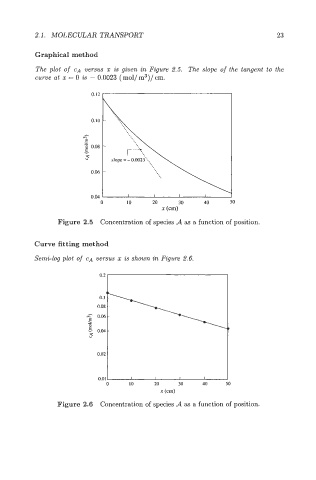

           Graphical method

           The plot  of  CA  versus x is given in Figure 2.5.  The slope  of the  tangent  to the
           curve ut  x = 0 is - 0.0023 ( mol/m3)/cm.

                           0.12


                             0       10     20      30     40     50
                                               x (cm)

                 Figure 2.5  Concentration of species d as a function of position.


           Curve fitting method
           Semi-log plot  of  CA uemus x is shown in Figure 2.6.


                            0.08 -
                         m^  0.06-
                          E
                          L
                          8
                          - 0.04-
                          3
                            0.02 -


                             0.01     I      I      I      I
                               0      IO     20     30    40
                                              x (cm)
                 Figure 2.6  Concentration of  species d as a function of position.
   37   38   39   40   41   42   43   44   45   46   47