
Page 211 - Modern Control Systems
P. 211
Section 3.5 Alternative Signal-Flow Graph and Block Diagram Models 185
l
" . O • -
" 2 O — *
(a)
4 1 x
- — • ' . a
u x S
1 r +
> — s X-i
i
7—
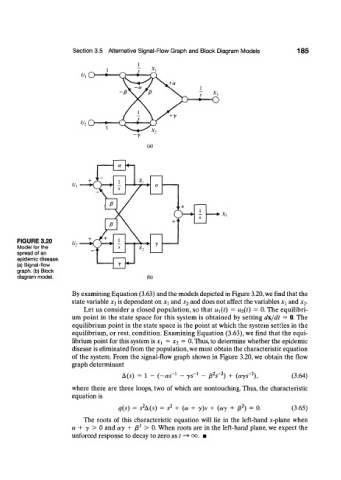
FIGURE 3.20 u 2 - 1
Model for the 5 X, y
spread of an - ^
epidemic disease. T
(a) Signal-flow r
graph, (b) Block
diagram model. (b)
By examining Equation (3.63) and the models depicted in Figure 3.20, we find that the
state variable * 3 is dependent on x-[ and x 2 and does not affect the variables Xi and x 2-
Let us consider a closed population, so that u\(t) = ^2(/) = 0. The equilibri-
um point in the state space for this system is obtained by setting dx/dt — 0. The
equilibrium point in the state space is the point at which the system settles in the
equilibrium, or rest, condition. Examining Equation (3.63), we find that the equi-
= 0. Thus, to determine whether the epidemic
librium point for this system is x v — x 2
disease is eliminated from the population, we must obtain the characteristic equation
of the system. From the signal-flow graph shown in Figure 3.20, we obtain the flow
graph determinant
2
2
A(s) = 1 - (-as~ l - ys' 1 - jSV ) + (ays' ), (3.64)
where there are three loops, two of which are nontouching. Thus, the characteristic
equation is
2
2
q{s) = s A(s) = s 2 + (a + y)s + (ay + jS ) = 0. (3.65)
The roots of this characteristic equation will lie in the left-hand s-plane when
a + y > 0 and ay + ft 2 > 0. When roots are in the left-hand plane, we expect the
unforced response to decay to zero as t —*• 00. •