
Page 289 - Modern Control Systems
P. 289
Section 4.8 Design Examples 263
0.2
Curve fit
0.15
0.05
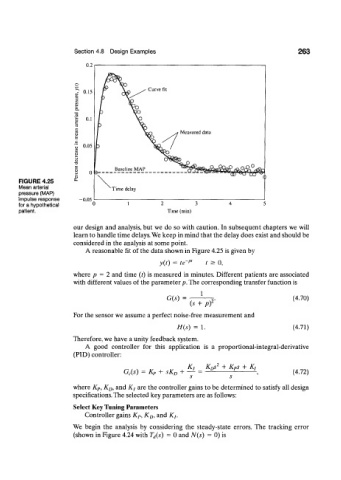
FIGURE 4.25
Mean arterial ' Time delay
pressure (MAP)
impulse response -0.05
for a hypothetical 0 1 2 3
patient. Time (min)
our design and analysis, but we do so with caution. In subsequent chapters we will
learn to handle time delays. We keep in mind that the delay does exist and should be
considered in the analysis at some point.
A reasonable fit of the data shown in Figure 4.25 is given by
y{t) = te~ pt t > 0,
where p = 2 and time (t) is measured in minutes. Different patients are associated
with different values of the parameter p. The corresponding transfer function is
1
G(s) = (4.70)
For the sensor we assume a perfect noise-free measurement and
H(s) = 1. (4.71)
Therefore, we have a unity feedback system.
A good controller for this application is a proportional-integral-derivative
(PID) controller:
K, Kos 2 + K Ps + Kj
G c(s) = Kp + sK D + (4.72)
where K P, K D, and K f are the controller gains to be determined to satisfy all design
specifications. The selected key parameters are as follows:
Select Key Tuning Parameters
Controller gains K P, K D, and K {.
We begin the analysis by considering the steady-state errors. The tracking error
(shown in Figure 4.24 with T d(s) = 0 and N(s) = 0) is