
Page 293 - Modern Control Systems
P. 293
Section 4.8 Design Examples 267
We conclude the analysis by considering the disturbance response. From previous
analysis we know that the transfer function from the disturbance input T d(s) to the
output Y(s) is
-G(s)
Y(s) = TM
1 + G c(s)GJs)G(s)
—r Us)-
s A + 2/75 3 + (p 2 + K D)s 2 + K Ps + K[
To investigate design specification DS4, we compute the disturbance step response
with
D 5 0
Tf\ °
This is the maximum magnitude disturbance (|r rf(f)| = DQ = 50). Since any step
disturbance of smaller magnitude (that is, (7^)1 = D 0 < 50) will result in a
smaller maximum output response, we need only to consider the maximum mag-
nitude step disturbance input when determining whether design specification DS4
is satisfied.
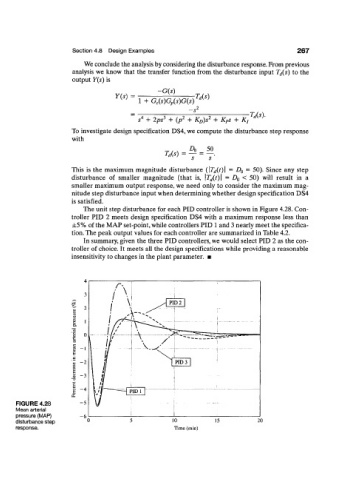
The unit step disturbance for each PID controller is shown in Figure 4.28. Con-
troller PID 2 meets design specification DS4 with a maximum response less than
±5% of the MAP set-point, while controllers PID 1 and 3 nearly meet the specifica-
tion. The peak output values for each controller are summarized in Table 4.2.
In summary, given the three PID controllers, we would select PID 2 as the con-
troller of choice. It meets all the design specifications while providing a reasonable
insensitivity to changes in the plant parameter. •
FIGURE 4.28
Mean arterial
pressure (MAP)
disturbance step 10
response. Time (min)