
Page 298 - Modern Control Systems
P. 298
272 Chapter 4 Feedback Control System Characteristics
can be altered by feedback control gain, K. Based on our analysis thus far, we would
prefer to use K = 20. Other considerations must be taken into account before we
can establish the final design.
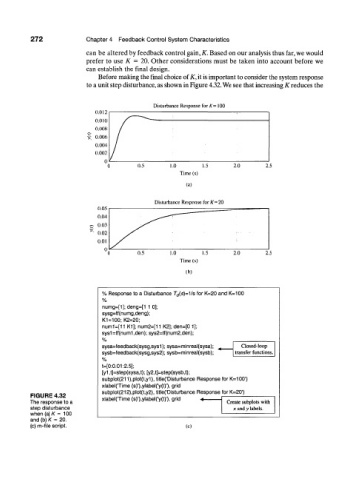
Before making the final choice of K, it is important to consider the system response
to a unit step disturbance, as shown in Figure 4.32. We see that increasing K reduces the
Disturbance Response for K = 100
(a)
Disturbance Response for K=20
(b)
% Response to a Disturbance T d(s)=Ms for K=20 and K=100
%
numg=[1]; deng=[1 1 0];
sysg=tf(numg,deng);
K1=100; K2=20;
num1=[11 K1]; num2=[11 K2]; den=[0 1];
sys1=tf(num1 ,den); sys2=tf(num2,den);
%
sysa=feedback(sysg,sys1); sysa=minreal(sysa); . Closed-loop
sysb=feedback(sysg,sys2); sysb=minreal(sysb); transfer functions.
%
t=[0:0.01:2.5];
[y1 ,t]=step(sysa,t); [y2,t]=step(sysb,t);
subplot(211),plot(t,y1), title('Disturbance Response for K=100')
xlabel(Time (s)'),ylabel('y(t)'), grid
subplot(212),plot(t,y2), title('Disturbance Response for K=20")
FIGURE 4.32 xlabel('Time (s)'),ylabel('y(t)'), grid -4
The response to a Create subplots with
step disturbance x and y labels.
when (a) K = 100
and (b) K = 20.
(c) m-file script. (c)