
Page 299 - Modern Control Systems
P. 299
Section 4.10 Sequential Design Example: Disk Drive Read System 273
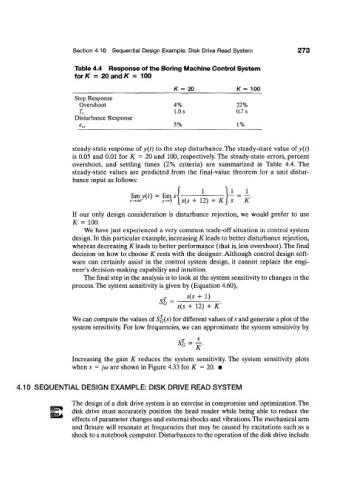
Table 4.4 Response of the Boring Machine Control System
forK = 20 and K = 100
K= 20 K ~ 100
Step Response
Overshoot 4% 22%
1.0 s 0.7 s
T s
Disturbance Response
e„ 5% 1%
steady-state response of y(t) to the step disturbance. The steady-state value of y(t)
is 0.05 and 0.01 for K = 20 and 100, respectively. The steady-state errors, percent
overshoot, and settling times (2% criteria) are summarized in Table 4.4. The
steady-state values are predicted from the final-value theorem for a unit distur-
bance input as follows:
lim y(t) = lim si — — — >— = —.
, - « / v ' , - 0 [s(s + 12) + KJ s K
If our only design consideration is disturbance rejection, we would prefer to use
K = 100.
We have just experienced a very common trade-off situation in control system
design. In this particular example, increasing K leads to better disturbance rejection,
whereas decreasing K leads to better performance (that is, less overshoot).The final
decision on how to choose K rests with the designer. Although control design soft-
ware can certainly assist in the control system design, it cannot replace the engi-
neer's decision-making capability and intuition.
The final step in the analysis is to look at the system sensitivity to changes in the
process. The system sensitivity is given by (Equation 4.60),
_ s(s + 1)
T
S
s(s + 12) + K'
We can compute the values of SG(S) for different values of.? and generate a plot of the
system sensitivity. For low frequencies, we can approximate the system sensitivity by
s
Increasing the gain K reduces the system sensitivity. The system sensitivity plots
when s = jco are shown in Figure 4.33 for K = 20. •
4.10 SEQUENTIAL DESIGN EXAMPLE: DISK DRIVE READ SYSTEM
The design of a disk drive system is an exercise in compromise and optimization. The
disk drive must accurately position the head reader while being able to reduce the
effects of parameter changes and external shocks and vibrations. The mechanical arm
and flexure will resonate at frequencies that may be caused by excitations such as a
shock to a notebook computer. Disturbances to the operation of the disk drive include