
Page 111 - Modern Control of DC-Based Power Systems
P. 111
Small-Signal Analysis of Cascaded Systems 75
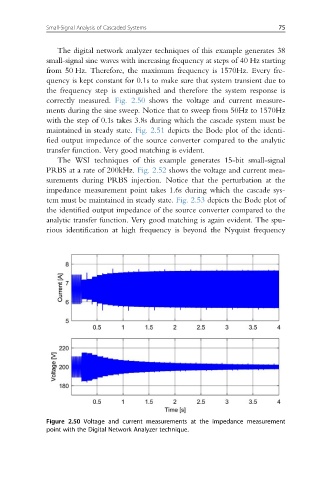
The digital network analyzer techniques of this example generates 38
small-signal sine waves with increasing frequency at steps of 40 Hz starting
from 50 Hz. Therefore, the maximum frequency is 1570Hz. Every fre-
quency is kept constant for 0:1s to make sure that system transient due to
the frequency step is extinguished and therefore the system response is
correctly measured. Fig. 2.50 shows the voltage and current measure-
ments during the sine sweep. Notice that to sweep from 50Hz to 1570Hz
with the step of 0:1s takes 3:8s during which the cascade system must be
maintained in steady state. Fig. 2.51 depicts the Bode plot of the identi-
fied output impedance of the source converter compared to the analytic
transfer function. Very good matching is evident.
The WSI techniques of this example generates 15-bit small-signal
PRBS at a rate of 200kHz. Fig. 2.52 shows the voltage and current mea-
surements during PRBS injection. Notice that the perturbation at the
impedance measurement point takes 1:6s during which the cascade sys-
tem must be maintained in steady state. Fig. 2.53 depicts the Bode plot of
the identified output impedance of the source converter compared to the
analytic transfer function. Very good matching is again evident. The spu-
rious identification at high frequency is beyond the Nyquist frequency
Figure 2.50 Voltage and current measurements at the impedance measurement
point with the Digital Network Analyzer technique.